Calculating Probabilities on each Table of Outcomes
TABLES OF OUTCOMES
Tables of outcomes are tables which compare two categorical variables. They usually result from a survey.
For example, a group of teachers were asked which mode of transport they used to travel to school. Their responses are summarised in the table below. The variables are gender and mode of transport.
In the following example we will see how these tables can be used to estimate probabilities. To help us, we extend the table to include totals in each row and column.
Q1. A box contains coloured blocks. The number of each colour is given in the following table.
A block is selected randomly. What is the probability that the block will be:
a) purple
Solution:
Before we answer the questions we first work out how many blocks there are in total. This gives us the sample space: n(S)=24+32+41+19=116. The probability that a block is purple is:
P(purple)= n(E)/n(S)
=24/116=0.21
b) purple or white
Solution:
The probability that a block is either purple or white is:
c) pink and orange
Solution:
Since one block cannot be two colours the probability of this event is 0.
d) not orange
Solution:
We first work out the probability that a block is orange:
P(orange)=32/116=0.28
The probability that a block is not orange is:
P(not orange)=1-0.28=0.72
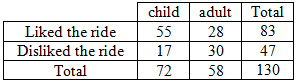
Q2. People exiting a new ride at a theme park were asked whether they liked or disliked the ride. The results are shown in the table below.
Use this table to estimate the probability that a randomly selected person who went on the ride:
a) liked the ride
b) is a child and disliked the ride
c) is an adult or disliked the ride
d) liked the ride, given that he or she is a child
e) is an adult, given that he or she disliked the ride.
Solutions:
We extend the table to include totals:
a) 83 out of the 130 people surveyed liked the ride.
P(liked the ride)≈83/130≈0.638
b) “An adult or disliked the ride” means “an adult or disliked the ride, or both”. 17 of the 130 people surveyed are children who disliked the ride.
P(child and disliked the ride) ≈ 17/130≈0.131
c) 28+30+17=75 of the 130 people are adults or disliked the ride.
P(adults or disliked the ride) ≈ 75/130≈0.577
d) Of the 72 children, 55 liked the ride.
P(liked the ride given that he or she is a child) ≈ 55/72≈0.764
e) Of the 47 people who disliked the ride, 30 were adults.
P(adult given that he or she disliked the ride) ≈ 55/72≈0.638
Q3. Use the contingency table below to answer the following questions.
a) What is the probability that someone with black hair has brown eyes?
b) What is the probability that someone has black hair?
c) What is the probability that someone has brown eyes?
d) Are having black hair and having brown eyes dependent or independent events?
Solutions:
a) 80 people have black hair and of those, 50 people also have brown eyes. Therefore the probability that someone with black hair has brown eyes is 50/80=⅝. Note: this is different from asking for the probability of having black hair and brown eyes. (This probability is computed in part (d) below.) The question was phrased to ask for the probability of having brown eyes given that a person has black hair.
b) Out of a total of 230. 80 have black hair. Therefore the probability that someone has black hair is 80/230=8/23.
c) Out of a total of 230. 120 have brown eyes. Therefore the probability that someone has brown eyes is 120/230=12/23.
d) We already computed that the probability of having
● black hair is 8/23; and
● brown eyes is 12/23.
Since 50 out of 230 people have black hair and brown eyes, the probability of having black hair and brown eyes is 5/23
We conclude that having black hair and brown eyes are dependent events since 5/23≠8/23×12/23.
Q4. People exiting a new ride at a theme park were asked whether they liked or disliked the ride. The results are shown in the table below.
Use this table to estimate the probability that a randomly selected person who went on the ride:
a) liked the ride
b) is a child and disliked the ride
c) is an adult or disliked the ride
d) liked the ride, given that he or she is a child
e) is an adult, given that he or she disliked the ride.
Solutions:
We extend the table to include totals:
a) 83 out of the 130 people surveyed liked the ride.
P(liked the ride)≈83/130≈0.638
b) “An adult or disliked the ride” means “an adult or disliked the ride, or both”. 17 of the 130 people surveyed are children who disliked the ride.
P(child and disliked the ride) ≈ 17/130≈0.131
c) 28+30+17=75 of the 130 people are adults or disliked the ride.
P(adults or disliked the ride) ≈ 75/130≈0.577
d) Of the 72 children, 55 liked the ride.
P(liked the ride given that he or she is a child) ≈ 55/72≈0.764
e) Of the 47 people who disliked the ride, 30 were adults.
P(adult given that he or she disliked the ride) ≈ 55/72≈0.638
Q5. Given the following contingency table, identify the events and determine whether they are dependent or independent.
Solution:
The events are whether a bus leaves from Location A or not and whether a bus left late or not.
We test whether the Location A and the left late events are independent. The total number of buses in the contingency table is 100. We determine the proba- bilities of the different events from the values in the table-
● leaving from Location A: 40/100=0.4;
● leaving late: 55/100=0.55;
● leaving from Location A and leaving late: 15/100=0.15;
Since 0.4×0.55=0.22≠0.15, the events are dependent.
Q6. You are given the following information.
● Events A and B are independent.
● P(not A)=0.3.● P(B)=0.4.
Complete the contingency table below.
Solution:
From the given table, we see that the total number of outcomes is 50. Since P(not A)=0.3 we have n(not A)=0.3×50=15 and n(A)=50-15=35. Since P(B)=0.4 we have n(B)=0.4×50=20 and n(not B)=50-20=30. From this we can partially complete the table:
Next, we use the fact that A and B are independent. From the definition of independence
P((not A) and B)=P(not A)×P(B)=0.3×0.4=0.12
Therefore n((not A) and B)=0.12 x 50=6. We find the rest of the values in the table by making sure that each row and column sums to its total.
Q7. Complete the following contingency table and determine whether the events are dependent or independent.
Solution:
We complete the contingency table by making sure that all the rows and columns sum to the correct totals.
Since
● P(Durban)=270/500=0.54;
● P(liked living there)=160/500=0.32;
● P(Durban and liked living there)=130/500=0.26;
and since 0.54×0.32=0.1728≠0.26 the events are dependent.
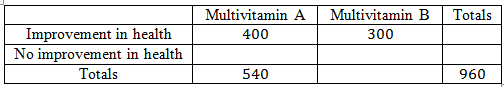
Q8. Summarise the following information about a medical trial with 2 types of multi- vitamin in a contingency table and determine whether the events are dependent or independent.
● 960 people took part in the medical trial.
● 540 people used multivitamin A for a month and 400 of those people showed an improvement in their health.
● 300 people showed an improvement in health when using multivitamin B for a month.
If the events are independent, it means that the two multivitamins have the same effect on people. If the events are dependent, it means that one multivitamin is better than the other. Which multivitamin is better than the other, or are the both equally effective?
Solution:
From the information in the problem, we can draw up the following partially completed contingency table.
We complete the table by ensuring that all rows and columns add up to the correct totals.
Since
● P(Multivitamin A)=540/960=9/16;
● P(Improvement in health) = 700/960=35/48;
● P(Multivitamin A and Improvement in health) = 400/960=5/12;
and since 9/16 × 35/48 = 105/256 ≠ 5/12 the events are dependent.
With Multivitamin A, 400/540=74.1% of the people showed an improvement in health. With Multivitamin B, 300/420=71.4% of the people showed an improvement in health. Therefore Multivitamin A is more effective than Multivitamin B.
We can also use a contingency table to represent all possible outcomes of events.
Look at the same example we used for the tree diagram above: What is the probability of these two events?
— Event A: Drawing a heart card from a pack of cards and putting it back.
— Event B: Drawing a heart card from the pack again.
We can make a table of possible outcomes using columns for the type of card drawn and rows for the events:
Numbers in each row add up to totals on the right.
Numbers in each column up to totals below the table.
Q9. The hair colour of 50 learners was recorded. The table below represents the information
Calculate the probability that learner chosen at random:
1) will have brown hair
2) will have blond hair
3) will have black hair or brown hair
4) will have blond hair or brown hair or black hair
Solutions
1) 17 learners have brown hair out of a total of 50 ∴P(brown hair) =17/50
2) 11 learners have blond hair out of a total of 50 ∴P(blond hair) =11/50
3) 22+17=39 learners have black or brown hair out of a total of 50
P(black or brown hair) = 39/50
4) 22+17+11=50 learners have black or brown or blond hair out of a total of 50
∴ P(black or brown or blond hair) =50/50=1
Q10. A small nursery school has a class with children of various ages. The table gives the number of children of each age in the class.
If a child is selected at random what is the probability that the child will be:
a) a female
Solution:
We calculate the total number of pupils at the school: 6+2+5+7+4+6=30.
The total number of female children is 6+5+4=15.
The probability of a randomly selected child being female is:
P(E)= n(E)/n(S)
P(female)=15/30=0.5
b) a 4 year old male
Solution:
The probability of a randomly selected child being a 4 year old male is:
P(male)=7/30=0.23
c) aged 3 or 4
Solution:
There are 6+2+5+7=20 children aged 3 or 4. The probability of a randomly selected child being either 3 or 4 is: 20/30=0.67.
d) aged 3 and 4
Solution:
A child cannot be both 3 and 4, so the probability is 0.
e) not 5
Solution:
This is the same as a randomly selected child being either 3 or 4 and so is 0.67.
f) either 3 or female
Solution:
The probability of a child being either 3 or female is:


")
")


