Percentiles:
The values which divide an array into one hundred equal parts are called percentiles. The first, second, …. Ninety-ninth percentile are denoted by P1, P2, … and P99. The 50th percentile (P50) corresponds to the median. The 25thpercentile (P25) corresponds to the first quartile and the 75th percentile (P75) corresponds to the third quartile.
Percentiles for Ungrouped Data:
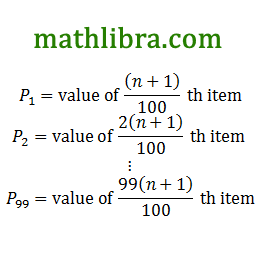
Percentile from ungrouped data could be calculated from the following formulae;
For Example:
We will calculate fifteenth, thirty-seventh and sixty-fourth percentile from the following array;
55 58 61 67 68 70 74 81 82 93
The data set has been arranged in ascending order from the top-left corner to the bottom-right one.
i.

=3.15th item from below
The value of the 3rd item is 29 and that of the 4th item is 30. Thus the 15th percentile is 0.15th item the way between 29 and 30, which will be calculated as 29+0.15=29.15. Hence, P15=29.15.
ii.

=7.77th item from below
The value of 7th item is 39 and that of the 8th item is 42. Thus the 37th percentile is 0.77th of the between 39 and 42, which will be calculate as 39+3⋅0.77=41.31. Hence, P37= 41.31.
iii.

=13.44th item from below
The value of the 13th item is 61 and that of the 14th item is 67. Thus, the 64th percentile is 0.44th of the way between 61 and 67. Since the difference between 61 and 67 is 6 so 64th percentile will be calculated as 61+6(0.44)=63.64. Hence, P64= 63.64.
Let’s read post Calculation of Percentiles for Grouped Data.


