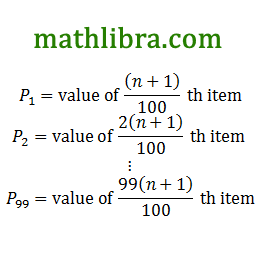
● The percentiles divide the data into 100 equal parts.
● Percentiles are the 99 data values that divide a data set into 100 groups.
● Every part has the same number of items.
● Percentiles give an indication of how many values in the data set are smaller than a certain value.
● For example, the 56th percentile of 70 means that 56% of the other values are less than 70.
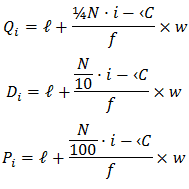
The calculation of percentiles is identical to the calculation of quartiles, except the aim is to divide the data values into 100 groups instead of the 4 groups required by quartiles.
Method: Calculating the percentiles
i. Order the data from smallest to largest or from largest to smallest.
ii. Count how many data values there are in the data set.
iii. Divide the number of data values by 100. The result is the number of data values per group.
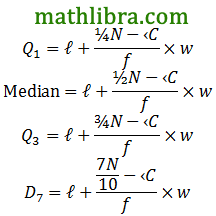
iv. Determine the data values corresponding to the first, second and third quartiles using the number of data values per quartile.
The central tendency is not the only interesting or useful information about a data set. The two data sets illustrated below have the same mean (0), but have different spreads around the mean. Each circle represents one value from the data set (or one datum).

Dispersion is a general term for different statistics that describe how values are distributed around the centre. In this section we will look at measures of dispersion.
Percentiles
Definition: Percentile
The p-th percentile is the value, v, that divides a data set into two parts, such that p percent of the values in the data set are less than v and 100-p percent of the values are greater than v. Percentiles can lie in the range 0≤p≤100.
To understand percentiles properly, we need to distinguish between 3 different aspects of a datum: its value, its rank and its percentile:
● The value of a datum is what we measured and recorded during an experiment or survey.
● The rank of a datum is its position in the sorted data set (for example, first, second, third, and so on).
● The percentile at which a particular datum is, tells us what percentage of the values in the full data set are less than this datum.
The table below summarises the value, rank and percentile of the data set:

As an example, 13.0 is at the 40th percentile since there are 2 values less than 13.0 and 3 values greater than 13.0.

In general, the formula for finding the p-th percentile in an ordered data set with n values is

This gives us the rank, r, of the p-th percentile. To find the value of the p-th percentile, we have to count from the first value in the ordered data set up to the r-th value.
Sometimes the rank will not be an integer. This means that the percentile lies between two values in the data set. The convention is to take the value halfway between the two values indicated by the rank.
The figure below shows the relationship between rank and percentile graphically. We have already encountered three percentiles in this chapter: the median (50th percentile), the minimum (0th percentile) and the maximum (100th). The median is defined as the value halfway in a sorted data set.

Worked example 1: Using the percentile formula
QUESTION
Determine the minimum, maximum and median values of the following data set using the percentile formula.
SOLUTION
Before we can use the rank to find values in the data set, we always have to order the values from the smallest to the largest. The sorted data set is:
We already know that the minimum value is the first value in the ordered data set. We will now confirm that the percentile formula gives the same answer. The minimum is equivalent to the 0th percentile. According to the percentile formula the rank, r, of the p=0th percentile in a data set with n=9 values is:

This confirms that the minimum value is the first value in the list, namely 7.
Step 3: Find the maximum
We already know that the maximum value is the last value in the ordered data set. The maximum is also equivalent to the 100th percentile. Using the percentile formula with p=100th and n=9, we find the rank of the maximum value is:

This confirms that the maximum value is the last (the ninth) value in the list, namely 45.
Step 4: Find the median
The median is equivalent to the 50th percentile. Using the percentile formula with p=50 and n=9, we find the rank of the median value is:

This shows that the median is in the middle (at the fifth position) of the ordered data set. Therefore the median value is 19.
Definition: Quartiles
The quartiles are the three data values that divide an ordered data set into four groups, where each group contains an equal number of data values. The median (50th percentile) is the second quartile (Q2). The 25th percentile is also called the first or lower quartile (Q1). The 75th percentile is also called the third or upper quartile (Q3).
Worked example 2: Quartiles
QUESTION
Determine the quartiles of the following data set:
SOLUTION
Step 1: Sort the data set
Step 2: Find the ranks of the quartiles
Using the percentile formula with n=12, we can find the rank of the 25th, 25th and 75th percentiles:

Step 3: Find the values of the quartiles
Note that each of these ranks is a fraction, meaning that the value for each percentile is somewhere in between two values from the data set.
For the 25th percentile the rank is 3.75, which is between the third and fourth values. Since both these values are equal to 7, the 25th percentile is 7.
For the 50th percentile (the median) the rank is 6.5, meaning halfway between the sixth and seventh values.
The sixth value is 11 and the seventh value is 12, which means that the median is (11+12)/2=11.5. For the
75th percentile the rank is 9,25, meaning between the ninth and tenth values. Therefore the 75th percentile is (31+35)/2=33
Let’s read the post ‘Quartiles and the Interquartile Range for Ungrouped Data’.
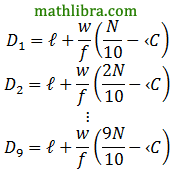
The deciles are the nine data values that divide an ordered data set into ten groups, where each group contains an equal number of data values.
For example, consider the ordered data set:
92; 95; 101; 105; 111; 117; 118; 125; 127; 131; 137; 139; 141
The nine deciles are: 35; 59; 69; 78; 86; 95; 111; 125; 137.
In grouped data, the percentiles will lie somewhere inside a range, rather than at a specific value. To find the range in which a percentile lies, we still use the percentile formula to determine the rank of the percentile and then find the range within which that rank is.
Worked example 3: Percentiles in grouped data
QUESTION
The mathematics marks of 100 grade 10 learners at a school have been collected. The data are presented in the following table:

1. Calculate the mean of this grouped data set.
2. In which intervals are the quartiles of the data set?
3. In which interval is the 30th percentile of the data set?
SOLUTION
Step 1: Calculate the mean
Since we are given grouped data rather than the original ungrouped data, the best we can do is approximate the mean as if all the learners in each interval were located at the central value of the interval.

Step 2: Find the quartiles
Since the data have been grouped, they have also already been sorted. Using the percentile formula and the fact that there are 100 learners, we can find the rank of the 25th, 50th and 75th percentiles as

Now we need to find in which ranges each of these ranks lie.
● For the lower quartile, we have that there are 2+5=7 learners in the first two ranges combined and 2+5+18=25 learners in the first three ranges combined. Since 7<r25<25, this means the lower quartile lies somewhere in the third range: 30≤x<40. ● For the second quartile (the median), we have that there are 2+5+18+22=47 learners in the first four ranges combined. Since 47<r50<65, this means that the median lies somewhere in the fifth range: 50≤x<60. ● For the upper quartile, we have that there are 65 learners in the first five ranges combined and 65+13=78 learners in the first six ranges combined. Since 65<r75<78, this means that the upper quartile lies somewhere in the sixth range: 60≤x<70. Step 3: Find the 30th percentile
Using the same method as for the quartiles, we first find the rank of the 30th percentile.

Now we have to find the range in which this rank lies. Since there are 25 learners in the first 3 ranges combined and 47 learners in the first 4 ranges combined, the 30”‘ percentile lies in the fourth range: 40≤x<50.
We define data ranges in terms of percentiles. We have already encountered the full data range, which is simply the difference between the 100th and the 0th percentile (that is, between the maximum and minimum values in the data set).
Let’s read the post ‘The Range between the Largest and Smallest Values of the Data Set’.
Q1. What are the quartiles of this data set?
solution:
We first order the data set.
Next we find the ranks of the quartiles. Using the percentile formula with n=12, we can find the rank of the 25th, 50th and 75th percentiles:

Find the values of the quartiles. Note that each of these ranks is a fraction, meaning that the value for each percentile is somewhere in between two values from the data set.
For the 25th percentile the rank is 3.75, which is between the third and fourth values. Therefore the 25th percentile is (5+8)/2=6.5.
For the 50th percentile (the median) the rank is 6.5, meaning halfway between the sixth and seventh values. Therefore the median is (12+24)/2=18. For the 75th percentile the rank is 9.25, meaning between the ninth and tenth values.
Therefore the 75th percentile is (28+30)/2=29.
Therefore we get the following values for the quartiles: Q1=6.5;Q2=18;Q3=29.
Q2. A class of 12 learners writes a test and the results are as follows:
Find the range, quartiles and the interquartile range.
solution:
The data set is ordered.
The range is:
=91-20=71
To find the quartiles we start by finding the ranks of the quartiles. Using the percentile formula with n=12, we can find the rank of the 25th, 50th and 75th percentiles:

Find the values of the quartiles. Note that each of these ranks is a fraction, meaning that the value for each percentile is somewhere in between two values from the data set.
For the 25th percentile the rank is 3.75, which is between the third and fourth values. Therefore the 25th percentile is (40+43)/2=41.5.
For the 50th percentile (the median) the rank is 6.5, meaning halfway between the sixth and seventh values. Therefore the median is (46+53)/2=49.5. For the 75th percentile the rank is 9.25, meaning between the ninth and tenth values.
Therefore the 75th percentile is (63+70)/2=66.5. Therefore we get the following values for the quartiles: Q1=41.5;Q2=49.5;Q3=66.5.
lnterquartile range:
=66.5-41.5=25
Q3. Three sets of data are given:
Data Set 2: {7; 7; 8; 11; 13; 15; 16}
Data set 3: {11; 15; 16; 17; 19; 22; 24}
For each data set find:
a) the range
Solution:
All three data sets are ordered. To find the range we subtract the minimum value from the maximum value. Doing so for each data set gives the following values for the range.
Data set 2: 16-7=9
Data set 3: 24-11=13
b) the lower quartile
Solution:
For each data set n=7. Therefore the rank of the 25th percentile is the same for each data set:

Therefore for each data set the lower quartile lies between the second and third values.
The lower quartile for each data set is:
Data set 2: 7.5
Data set 3: 15.5
c) the median
Solution:
For each data set n=7. Therefore the rank of the 50th percentile is the same for each data set:

Therefore for each data set the median is the fourth value.
The median for each data set is:
Data set 2: 11
Data set 3: 17
d) the upper quartile
Solution:
For each data set n=7. Therefore the rank of the 75th percentile is the same for each data set:

Therefore for each data set the lower quartile lies between the fifth and sixth values.
The upper quartile for each data set is:
Data set 2: 14
Data set 3: 20.5
e) the interquartile range
Solution:
The interquartile range is calculated by subtracting the lower quartile from the upper quartile.
Data set 2: 14-7.5=6.5
Data set 3: 20.5-15.5=5
f) the semi-interquartile range
Solution:
The semi-interquartile range is half the interquartile range.
Data set 2: 6.5/2=3.25
Data set 3: 5/2=2.5
Percentiles of a Cumulative Frequency Graph
A percentile is the score which a certain percentage of the data lies at or below.
For example: ● the 85th percentile is the score which 85% of the data lies at or below.
● If your score in a test is the 95th percentile, then 95% of the class have scored the same or less than you.
Notice that: ● the lower quartile (Q1) is the 25th percentile
● the median (Q2) is the 50th percentile
● the upper quartile (Q3) is the 75th percentile.
A cumulative frequency graph provides a convenient way to find percentiles.
Another way to calculate percentiles is to add a separate scale to a cumulative frequency graph. On the graph below, the cumulative frequency is read from the axis on the left side, and each value corresponds to a percentile on the right side.

Let’s read the post ‘Cumulative Frequency Tables and Graphs (Ogives) (10 Examples)’.


