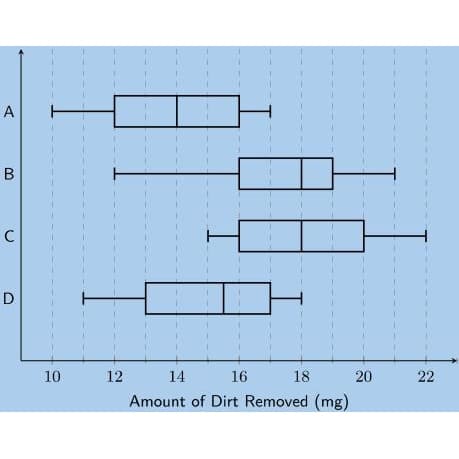
The example below shows a comparison of the amount of dirt removed by four brands of detergents (brands A to D).
a) Which brand has the biggest range, and what is this range?
Solution:
A: range =17-10=7
B: range =21-12=9
C: range =22-15=7
D: range =18-11=7
B has the biggest range. The range is 9.
b) For brand C, what does the number 18 mg represent?
Solution:
18 mg represents the median.
c) Give the interquartile range for brand B.
Solution:
=19-16=3
d) Which brand of detergent would you buy? Explain your answer.
Solution:
We need to compare several values to help us decide. These values are shown in the table below.

From this we see that brand C has the highest minimum value. Brand B has the smallest interquartile range but the largest range. It is possible that the minimum value for brand B is an outlier which would make brand B a better choice than brand C.
Considering all the data available it would be hard to choose between brand C and brand B. We can however say that brands A and D are not very good choices as they both have low minimum and maximum values.
Since brand C does not have a potential outlier this might be the best brand to choose.
Let’s read the post ‘Drawing Box-and-Whisker Plots (Boxplots)‘.
Embed the link of this post


")


