1. Five number summary
The five number summary is a ‘summary’ description of a data set. It is made of these five numbers:
● the minimum value
● the lower quartile
● the median
● the upper quartile
● the maximum value
Example 1. What is the five number summary for the set of data we have used so far?
6; 9; 9; 10; 11; 13; 13; 13; 13; 14; 14; 16; 17; 17; 18; 19; 19; 20; 21; 21; 21; 23; 24.
● the minimum Value: 6
● the lower quartile: 13
● the median: 16
● the upper quartile: 20
● the maximum value: 24
2. Box and whisker plot
We can represent the five number summary on a box and whisker plot (or diagram).
The box represents the middle half of the data (the interquartile range)
The line in the box shows the median.
The ‘whiskers’ show the minimum and maximum values

Quartiles divide data into four equal sets of data. The longer whisker and box means that the lower 50% of the scores is more spread out than the upper 50%.
Skewed to the right (Positively skewed) means that the upper half of the data is more spread out than the lower half.
Skewed data
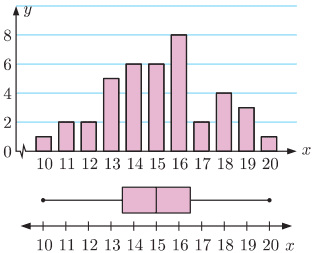
A box and whisker plot can show whether a data set is symmetrical, positively skewed or negatively skewed. This box and whisker plot is not symmetrical because the whiskers are not the same length and the median is not in the centre of the box. The whisker on the left is a bit longer than the whisker on the right, which shows that the data on the left of the box is more spread out. The box is also longer to the right of the median than to the left of the median. We say that the data is negatively skewed. (or skewed to the left).
A Set of data with a symmetric distribution will have a symmetric boxplot.
The whiskers of the boxplot are the same length and the median line is in the centre of the box.
A set of data which is positively skewed will have a positively skewed boxplot.
The right whisker is longer than the left whisker and the median line is to the left of the box.
A set of data which is negatively skewed will have a negatively skewed boxplot.
The left whisker is longer than the right whisker and the median line is to the right of the box.

Problem 1. These are the scores of ten students in a Science test:
a) Draw a box and whisker diagram for the given data.
b) Determine the interquartile range.
c) State whether the data is skewed or not.
Solution:
a) First write all the scores in ascending order.
10; 55; 60; 70; 75; 78; 80; 80; 82; 84; 85; 90
Work out the five number summary:
Minimum number: 10
Maximum number: 90
Median: 12 numbers, so use the 6th and 7th numbers.
Lower quartile: Use the first 6 numbers. The 3rd and 4th numbers are 60 and 70.
Upper quartile: Use the last 6 numbers. The 3rd and 4th numbers are 82 and 84.

b) Interquartile range = upper quartile – lower quartile
c) The data is skewed to the left (negatively skewed).
The whisker on the left is longer, i.e. the length on the left of the box is longer than the length on the right.
1. Symmetric and Skewed Data
The shape of a data set is important to know.
Definition: Shape of a data set
This describes how the data is distributed relative to the mean and median.
● Symmetrical data sets are balanced on either side of the median. It does not have to be exactly equal to be symmetric

● Skewed data is spread out on one side more than on the other. It can be skewed right or skewed left.


2. Relationship of the Mean, Median, and Mode
The relationship of the mean, median, and mode to each other can provide some information about the relative shape of the data distribution. If the mean, median, and mode are approximately equal to each other, the distribution can be assumed to be approximately symmetrical. With both the mean and median known the following can be concluded:
● (mean – median) ≈0 then the data is symmetrical
● (mean – median) >0 then the data is positively skewed (skewed to the right). This means that the median is close to the start of the data set.
● (mean – median) <0 then the data is negatively skewed (skewed to the left). This means that the median is close to the end of the data set.
Problem 2. Three sets of 12 learners each had their test scores recorded. The test was out of 50. Use the given data to answer the following questions.
| Set A | Set B | Set C |
|---|---|---|
| 25 | 32 | 43 |
| 47 | 34 | 47 |
| 15 | 35 | 16 |
| 17 | 32 | 43 |
| 16 | 25 | 38 |
| 26 | 16 | 44 |
| 24 | 38 | 42 |
| 27 | 47 | 50 |
| 22 | 43 | 50 |
| 24 | 29 | 44 |
| 12 | 18 | 43 |
| 31 | 25 | 42 |
a) For each of the sets calculate the mean and the five number summary.
b) Make box and whisker plots of the three data sets on the same set of axes.
c) State, with reasons, whether each of the three data sets are symmetric or skewed (either right or left).
Solution:
a) A. Mean=23.83. Five number summary=[12;16.5;24;26.5;47].
B. Mean=31.17. Five number summary=[16;25;32;36.5;47].
C. Mean=41.83. Five number summary=[16;42;43;45.5;50].
b)
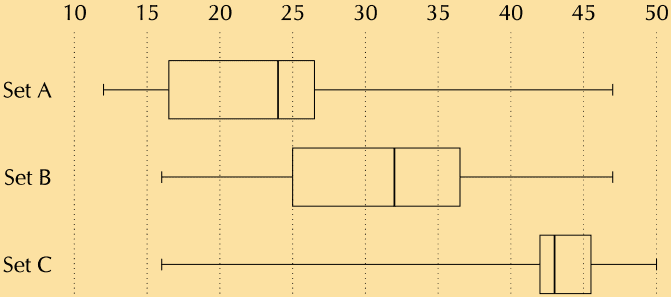
c) Set A: skewed left. Set B: slightly skewed left. Set C: skewed right.
P3. Draw a box and whisker diagram of the following data set and explain whether it is symmetric, skewed right or skewed left.
-0.8;-3.3;-4.5;-2.5;-4.4;-4.6;-4.4;-3.3
Solution:
The statistics of the data set are
● minimum: -4.6;
● first quartile: -4.1;
● median: -3.3;
● third quartile: -1.5;
● maximum: -0.8.
From this we can draw the box-and-whisker plot as follows.

Since the median is closer to the first quartile than the third quartile, the data set is skewed right.
P4. Is the following data set symmetric, skewed right or skewed left? Motivate your answer.
Solution:
The statistics of the data set are
● mean: 41.1;
● first quartile: 33;
● median: 41.5;
● third quartile: 45.
We can conclude that the data set is skewed left for two reasons.
(i) The mean is less than the median. There is only a very small difference between the mean and median, so this is not a very strong reason.
(ii) A better reason is that the median is closer to the third quartile than the first quartile.
P5. State whether each of the following data sets are symmetric, skewed right or skewed left.
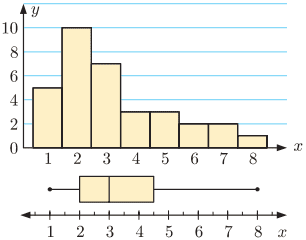
a) A data set with this histogram:
b) A data set with this box and whisker plot:

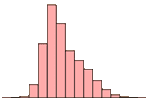
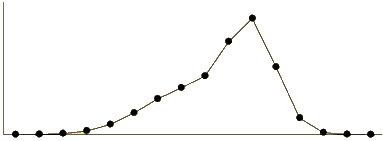
c) A data set with this frequency polygon:
d) The following data set:
Solution:
a) skewed right
b) skewed right
c) skewed left
d) The statistics of the data set are
● mean: 9.99; ● first quartile: 6.65; ● median: 9.95; ● third quartile: 13.05.
Note that we get contradicting indications from the different ways of determining whether the data is skewed right or left.
● The mean is slightly greater than the median. This would indicate that the data set is skewed right.
● The median is slightly closer to the third quartile than the first quartile. This would indicate that the data set is skewed left.
Since these differences are so small and since they contradict each other, we conclude that the data set is symmetric.

")


