boxplots,scatter plots,statistics, identification of outliers — effect of outliers on mean and median https://mathlibra.com/identification-of-outliers-effect-of-outliers-on-mean-and-median/
Identification of Outliers — Effect of Outliers on mean and median
Question 1. For each of the following data sets, draw a box and whisker plot and determine whether there are any outliers in the data.
a)
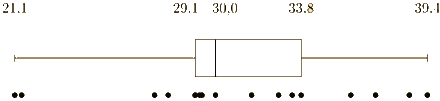
30;21.4;39.4;33.4;21.1;29.3;32.8;31.6;36;
27.9;27.3;29.4;29.1;38.6;33.8;29.1;37.1
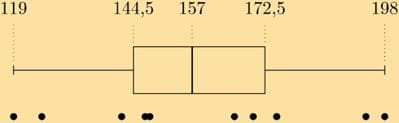
b) 198; 166; 175; 147; 125; 194; 119; 170; 142; 148
c) 7.1;9.6;6.3;-5.9;0.7;-0.1;4.4;-11.7;10;2.3;-3.7;5.8;-1.4;1.7;-0.7
Solution:
a) Below is the box-and-whisker plot of the data as well as dots representing the data themselves. Note that learners do not neeed to draw the dots, but this helps us to see that there are two outliers on the left.
b)
There are no outliers.
c)
There is one outlier on the left.
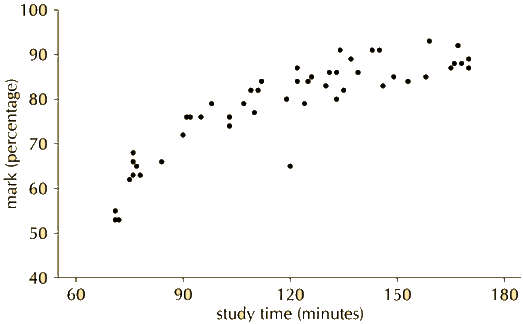
Question 2. A class’s results for a test were recorded along with the amount of time spent studying for it. The results are given below. Identify any outliers in the data.
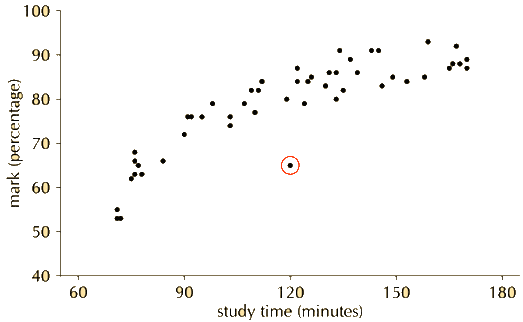
Solution: There is one outlier, marked in red below.
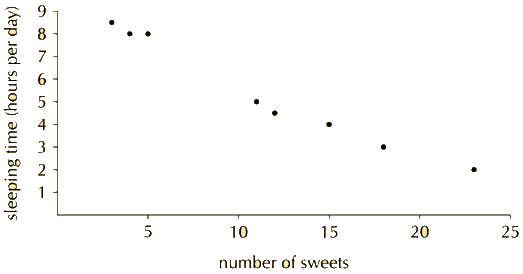
Question 3. Eight children’s sweet consumption and sleeping habits were recorded. The data are given in the following table and scatter plot.
Number of sweets per week
15
12
5
3
18
23
11
4
Average sleeping time (hours per day)
4
4.5
8
8.5
3
2
5
8
a) What is the mean and standard deviation of the number of sweets eaten per day?
b) What is the mean and standard deviation of the number of hours slept per day?
c) Make a list of all the outliers in the data set.
Solution:
a) Mean=11%. Standard deviation=6,69.
b) Mean=5%. Standard deviation=2,33.
c) There are no outliers.
OUTLIERS
Outliers are extraordinary data that are separated from the main body of the data. Outliers are either much larger or much smaller than most of the data.
A commonly used test to identify outliers involves the calculation of upper and lower boundaries:
● The upper boundary = upper quartile +1.5× IQR.
Any data larger than the upper boundary is an outlier.
● The lower boundary = lower quartile -1.5× IQR.
Any data smaller than the lower boundary is an outlier.
Each outlier is marked with an asterisk on a boxplot. There may be more than one outlier at either end.
Each whisker extends to the last value that is not an outlier.
1. Five number summary
Question 4. What is the five number summary for the set of data we have used so far?
6; 9; 9; 10; 11; 13; 13; 13; 13; 14; 14; 16; 17; 17; 18; 19; 19; 20; 21; 21; 21; 23; 24.
Answer:
● the minimum value: 6
● the lower quartile: 13
● the median: 16
● the upper quartile: 20
● the maximum value: 24
2. Identification of outliers
Question 5. Determine whether the minimum in the [Question 4] above is an outlier or not.
Solution:
Inter-quartile range =Q3–Q1
=20-13=7 Q1-1.5×IQR=13-1.5×7=2.5
6>2.5 ∴6 is not an outlier
Hint: To determine outliers:
● Determine the interquartile range
● Determine Q1-1.5×IQR
● If the minimum < the value of Q1-1.5×IQR, then it is an outlier.
● Determine Q3-1.5×IQR
● If the maximum > Q3-1.5×IQR,
Then it is an outlier.
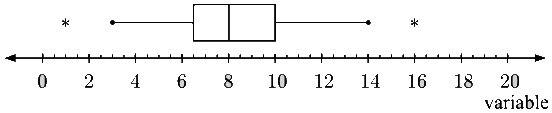
For example. Test the following data for outliers and hence construct a boxplot for the data:
IQR =Q3–Q1=3.5 Test for outliers:
upper boundary = upper quartile +1.5× IQR =10+1.5×3.5=15.25
lower boundary = lower quartile -1.5× IQR =6.5-1.5×3.5=1.25
16 is above the upper boundary, so it is an outlier.
1 is below the lower boundary, so it is an outlier.
Each whisker is drawn to the last value that is not an outlier.
The boxplot is:
Definition 1: outlier
An outlier is a value in the data set that is not typical of the rest of the set. It is usually a value that is much greater or much less than all the other values in the data set.
Definition 2: outlier
A point on a scatter plot which is widely separated from the other points or a result differing greatly from others in the same sample is called an outlier.
Worked example: Effect of outliers on mean and median
Question 6. The heights of 10 learners are measured in centimetres to obtain the following data set:
{150;172;153;156;146;157;157;143;168;157}
Afterwards, we include one more learner in the group, who is exceptionally tall at 181 cm. Compare the mean and median of the heights of the learners before and after the eleventh learner was included.
Solution: Step 1: Calculate the mean of the first 10 learners
Step 2: Calculate the mean of all 11 learners
From this we see that the average height changes by 158.2−155.9=2.3 cm when we introduce the outlier value (the tall person) to the data set. Step 3: Calculate the median of the first 10 learners
To find the median, we need to sort the data set:
{143;146;150;153;156;157;157;157;168;172}
Since there are an even number of values, 10, the median lies halfway between the fifth and sixth values:
median=½156+157=156.5 cm
Step 4: Calculate the median of all 11 learners
After adding the tall learner, the sorted data set is
{143;146;150;153;156;157;157;157;168;172;181}
Now, with 11 values, the median is the sixth value: 157 cm. So, the median changes by only 0.5 cm when we add the outlier value to the data set.
boxplots,scatter plots,statistics, identification of outliers — effect of outliers on mean and median https://mathlibra.com/identification-of-outliers-effect-of-outliers-on-mean-and-median/


")


