Data handling is the study of statistics, or data. We collect, organise, analyse and interpret data. The data can inform students, researchers, advertising and business.
It can provide us with an understanding of social issues and human trends. Then we can make informed decisions when we plan for the future, or make a new advertisement, or address social issues.
We usually collect data from a fairly small group (called the sample). The sample must be big enough and it must be randomly chosen from the population. This is to make sure that it fairly represents the trends in the larger group of people (called the population).

Sample: Some data randomly chosen from population.
A. Data
Definition: Data
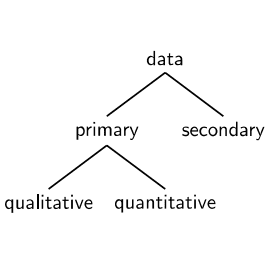
Data refers to the pieces of information that have been observed and recorded, from an experiment or a survey. There are two types of data: primary and secondary.
Data can be classified as primary or secondary, and primary or secondary data can be classified as qualitative or quantitative. Figure above summarises the classifications of data.
Primary data describes the original data that have been collected. This type of data is also known as raw data. Often the primary data set is very large and is therefore summarised or processed to extract meaningful information.
Purpose of Collecting Primary Data
Data is collected to provide answers that help with understanding a particular situation. Here are examples to illustrate some real world data collections scenarios in the categories of qualitative and quantitative data.
Qualitative Data
● The local government might want to know how many residents have electricity and might ask the question: “Does your home have a safe, independent supply of electricity?”
● A supermarket manager might ask the question: “What flavours of soft drink should be stocked in my supermarket?” The question asked of customers might be “What is your favourite soft drink?” Based on the customers’ responses, the manager can make an informed decision as to what soft drinks to stock.
● A company manufacturing medicines might ask “How effective is our pill at relieving a headache?” The question asked of people using the pill for a headache might be: “Does taking the pill relieve your headache?” Based on responses, the company learns how effective their product is.
● A motor car company might want to improve their customer service, and might ask their customers: “How can we improve our customer service?”
Qualitative data is information that cannot be written as numbers, for example, if you were collecting data from people on how they feel or what their favourite colour is.
Quantitative Data
● A cell phone manufacturing company might collect data about how often people buy new cell phones and what factors affect their choice, so that the cell phone company can focus on those features that would make their product more attractive to buyers.
● A town councillor might want to know how many accidents have occurred at a particular intersection, to decide whether a robot should be installed. The councillor would visit the local police station to research their records to collect the appropriate data.
● A supermarket manager might ask the question: “What flavours of soft drink should be stocked in my supermarket?” The question asked of customers might be “What is your favourite soft drink?” Based on the customers’ responses, the manager can make an informed decision as to what soft drinks to stock.
However, it is important to note that different questions reveal different features of a situation, and that this affects the ability to understand the situation. For example, if the first question in the list was re-phrased to be: ”Does your home have electricity?” then if you answered yes, but you were getting your electricity from a neighbour, then this would give the wrong impression that you did not need an independent supply of electricity.
Quantitative data is information that can be written as numbers, for example, if you were collecting data from people on their height or weight.
Secondary data is primary data that has been summarised or processed, for example, the set of colours that people gave as favourite colours would be secondary data because it is a summary of responses.
Transforming primary data into secondary data through analysis, grouping or organisation into secondary data is the process of generating information.
B. Methods of Data Collection
The method of collecting the data must be appropriate to the question being asked. Some examples of data collecting methods are:
1. Questionnaires, surveys and interviews
2. Experiments
3. Other sources (friends, family, newspapers, books, magazines and the Internet)
The most important aspect of each method of data collecting is to clearly formulate the question that is to be answered. The details of the data collection should therefore be structured to take your question into account.
When running an experiment or conducting a survey we can potentially end up with many hundreds, thousands or even millions of values in the resulting data set. Too much data can be overwhelming and we need to reduce them or represent them in a way that is easier to understand and communicate.
Statistics is about summarising data. The methods of statistics allow us to represent the essential information in a data set while disregarding the unimportant information. We have to be careful to make sure that we do not accidentally throw away some of the important aspects of a data set.
By applying statistics properly we can highlight the important aspects of data and make the data easier to interpret. By applying statistics poorly or dishonestly we can also hide important information and let people draw the wrong conclusions.
In this chapter we will look at a few numerical and graphical ways in which data sets can be represented, to make them easier to interpret.

Figure: Statistics is used by various websites to show users who is viewing their content.
Before the data collecting starts, it is important to decide how much data is needed to make sure that the results give an accurate reflection to the required answers. Ideally, the study should be designed to maximise the amount of information collected while minimising the effort. The concepts of populations and samples are vital to minimising effort.
The following terms should be familiar:
Population describes the entire group under consideration in a study. For example, if you wanted to know how many learners in your school got the flu each winter, then your population would be all the learners in your school.
Sample describes a group chosen to represent the population under consideration in a study. For example, for the survey on winter flu, you might select a sample of learners, maybe one from each class.
Random sample describes a sample chosen from a population in such a way that each member of the population has an equal chance of being chosen.

Choosing a representative sample is crucial to obtaining results that are unbiased. For example, if we wanted to determine whether peer pressure affects the decision to start smoking, then the results would be different if only boys were interviewed, compared to if only girls were interviewed, compared to both boys and girls being interviewed.
Therefore questions like: “How many interviews are needed?” and ” How do I select the candidates for the interviews?” must be asked during the design stage of the sampling process.
The most accurate results are obtained if the entire population is sampled for the survey, but this is expensive and time—consuming. The next best method is to randomly select a sample of subjects for the interviews. This means that whatever the method used to select subjects for the interviews, each subject has an equal chance of being selected. There are various methods of doing this for example, names can be picked out of a hat or can be selected by using a random number generator. Most modern scientific calculators have a random number generator or you can find one on a spreadsheet program on a computer.
So, if you had a total population of 1000 learners in your school and you randomly selected 100, then that would be the sample that is used to conduct your survey.
Example Data Sets
The remainder of this chapter deals with the mathematical details that are required to analyse the data collected.
The following are some example sets of data which can be used to apply the methods that are being explained.
Exercise of the Type Data Either Qualitative or Quantitative Data:
1. The following data set of dreams that learners have was collected from Grade 12 learners just after their final exams. {”I want to build a bridge!”; ”I want to help the sick.’’; ’’I want running water!”}
Categorise the data set.
Solution: This data set cannot be written as numbers and so must be qualitative. This data set is anecdotal since it takes the form of a story. Therefore the data set is qualitative anecdotal.
2. The following data set of sweets in a packet was collected from visitors to a sweet shop. {23; 25; 22; 26; 27; 25; 21; 28}
Categorise the data set.
Solution: This data set is a set of numbers and so must be quantitative. This data set is discrete since it can be represented by integers and is a count of the number of sweets. Therefore the data set is quantitative discrete.
3. The following data set of questions answered correctly was collected from a class of maths learners. {3;5;2;6;7;5;1;2}
Categorise the data set.
Solution: This data set is a set of numbers and so must be quantitative. This data set is discrete since it can be represented by integers and is a count of the number of questions answered correctly. Therefore the data set is quantitative discrete.
4. The following data set of heights was collected from a class of learners.
{1.70 m; 1.41 m; 1.60 m; 1.32 m; 1.80 m; 1.40 m}
Categorise the data set.
Solution:
This data set is a set of numbers and so must be quantitative. This data set is continuous since it cannot be represented by integers. Therefore the data set is quantitative continuous.
5. The following data set of sandwich spreads was collected from learners at lunch. {cheese; peanut butter; jam; cheese; honey} Categorise the data set.
Solution:
This data set cannot be written as numbers and so must be qualitative. This data set is categorical since it comes from a limited set of possibilities. Therefore the data set is qualitative categorical.
DEFINITION: Data
Data refers to the pieces of information that have been observed and recorded, from an experiment or a survey.
We distinguish between two main types of data: quantitative and qualitative.
DEFINITION: Quantitative data
Quantitative data are data that can be written as numbers.
Quantitative data can be discrete or continuous.
Discrete quantitative data can be represented by integers and usually occur when we count things, for example, the number of learners in a class, the number of molecules in a chemical solution, or the number of SMS messages sent in one day.
Continuous quantitative data can be represented by real numbers, for example, the height or mass of a person, the distance travelled by a car, or the duration of a phone call.
DEFINITION: Qualitative data
Qualitative data are data that cannot be written as numbers.
Two common types of qualitative data are categorical and anecdotal data. Categorical data can come from one of a limited number of possibilities, for example, your favourite cooldrink, the colour of your cell phone, or the language that you learnt to speak at home.
Anecdotal data take the form of an interview or a story, for example, when you ask someone what their personal experience was when using a product, or what they think of someone else’s behaviour.
Categorical qualitative data are sometimes turned into quantitative data by counting the number of times that each category appears. For example, in a class with 30 learners, we ask everyone what the colours of their cell phones are and get the following responses:

This is a categorical qualitative data set since each of the responses comes from one of a small number of possible colours.
We can represent exactly the same data in a different way, by counting how many times each colour appears.

This is a discrete quantitative data set since each count is an integer.
Worked example 1: Qualitative and quantitative data
QUESTION
Osas is interested in becoming an airtime reseller to his classmates. He would like to know how much business he can expect from them. He asked each of his 20 classmates how many SMS messages they sent during the previous day. The results were:

Is this data set qualitative or quantitative? Explain your answer.
SOLUTION
The number of SMS messages is a count represented by an integer, which means that it is quantitative and discrete.
Worked example 2: Qualitative and quantitative data
QUESTION
Osas would like to know who the most popular cellular provider is among learners in his school. This time Osas randomly selects 20 learners from the entire school and asks them which cellular provider they currently use. The results were:

is this data set qualitative or quantitative? Explain your answer.
SOLUTION
Since each response is not a number, but one ofa small number of possibilities, these are categorical qualitative data.


