statistics,presenting data, presenting data in frequency tables – statistics https://mathlibra.com/presenting-data-in-frequency-tables-statistics/mathlibra.com
Like already explained in the beginning, to investigate an object we need to do an observation or research. The result of observation is written and collected until we get something what we call data. Data which is collected can be numeric data (quantitative), for example the number of empty seat in every flight: 1, 2, 3, etc or can be categorical data for example in argument polling we can collect responses: yes or no.
To collect data about object that observed, we can do some ways, like:
1. Literature Exploring
There is a time, something that we want to observe had been observed before and the result was written. The result that had already received can be reused some or the whole, as much as needed.
2. Questionnaire
Questionnaire is one of ways in collecting data. In questionnaire we have list of question that are needed to be answered by respondent that had been chosen before.
3. Interview
Interview is one way in collecting data. By interviewing, data that is needed is asked directly to respondent that had been chosen.
4. Observation
Collecting data by observation is a technique which research or observe the object directly. This technique is much used by researchers from various disciplines.
Presenting Data
Data which are collected can be small (little amount of observation), or big (great amount of observation). If it is a small one, it mustn’t be so hard to observe or to proceed and the data can be presented randomly. But if it is a big one, then we have to present it in such way that it will be easy to be observed or proceeded.
Presenting Data in Frequency Tables A random data set can be presented in A frequency table. There are usually two columns and few rows in a frequency table. First column is filled by observation values and second columns is filled by its frequency. In making frequency table, sometimes we need to add one column between the two columns mentioned before, and this column can be used as a place to sum up the frequency of observation values.
Example 1, consider the data set:
A tally is used to count the number of 1s, 2s, 3s, and so on. As we read the data from left to right, we place a vertical stroke in the tally column. We use IIII to represent 5.
The frequency column summarises the number of each particular data value.
The relative frequency column measures the percentage of the total number of data Values that are in each group.
A frequency table is used to sort and count information.
Earlier, we collected data about the first names of 26 learners:
We can count how many times each length of name occurs and summarise this information in a frequency table. In this way, we group the data into categories, or class intervals.
Example 2:
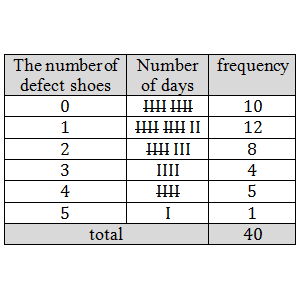
A factory which produce shoes want to observe the number of defect shoes produced everyday. For that, 40 samples are taken randomly. Below are the data got from the observation.
Present this data in a frequency table.
Solution:
Consider that the observation values (the number of defect shoes produced everyday) are: 0, 1, 2, 3, 4 and 5. This values will be placed in first column. Then, we will count how many times number 0, 1, 2, 3 and 5 show up, and the result will be placed in second column, then the summary of that counting will be placed in third column and this result is called frequency.
That table can be simpler presented as the following.
Or its transpose:
Presenting data in a frequency table can make us easier to observe a few thing, like:
i. we can see that in 40 working days, there are 10 days which is not produced defect shoes.
ii. we can count that in 40 working days, there are 10 days (4+5+1) which produce more than two defect shoes every day.
iii. we can see that in 40 working days, defect shoes are never more than 5 every day.
Example 3:
Suppose, a Survey-Company do a survey to observe figures who are considered as superior to be a director in a public company. Let’s say there are 5 candidates. Alan, Brian, Cerenity, Daisy, Emily. Respondents are asked to send SMS and write the first alphabet of figure’s name they chosen. And the result is:
A,C,A,E,E,E,E,E,A,B,A,A,C,C,C,C,A,A,A,B,E,E,E,B,B,A,A,E,E,E,A,A,A,D,D,D,A,A,E,E,E,C,C,C,C,E,E,E,E,A,A,A,A,B,B,B,E,B,E,E,E,E,E,E,B,B,B,C,C,C,C,D,D,D,D,D,C,C,A,A,A,B,B,B,A,A,C,C,C,C,E,E,B,E,E,E,C,C,C,C,C,B,B,B,C,C,C,C,C,D,D,D,D,E,E,E,C,E,E,E,E,E.
Make a frequency table from the data above.
Solution:
Below is the frequency table
Grouping Data
One of the first steps to processing a large set of raw data is to arrange the data values together into a smaller number of groups, and then count how many of each data value there are in each group. The groups are usually based on some sort of interval of data values, so data values that fall into a specific interval, would be grouped together. The grouped data is often presented graphically or in a frequency table. (Frequency means “how many times”)
A common way of handling continuous quantitative data is to subdivide the full range of values into a few sub-ranges. By assigning each continuous value to the sub-range or class within which it falls, the data set changes from continuous to discrete.
Grouping is done by defining a set of ranges and then counting how many of the data fall inside each range. The sub-ranges must not overlap and must cover the entire range of the data set.
One way of visualising grouped data is as a histogram. A histogram is a collection of rectangles, where the base of a rectangle (on the: x-axis) covers the values in the range associated with it, and the height of a rectangle corresponds to the number of values in its range.
Worked Example: Grouping Data
Question: Group the elements of Data Set 1 to determine how many times the coin landed heads-up and how many times the coin landed tails-up.
Data Set 1: Tossing a Coin
A fair coin was tossed 100 times and the values on the top face were recorded.
This table: Results of 100 tosses of a fair coin. H means that the coin landed heads-up and T means that the coin landed tails-up.
Answer
Step 1: Identify the groups
There are two unique data values: H and T. Therefore there are two groups, one for the H-data values and one for the T-data values.
Step 2: Count how many data values fall into each group.
Step 3: Check that the total of the frequency column is equal to the total number of data values.
There are 100 data values and the total of the frequency column is 44+56=100.
Exercises of Grouping Data
1. The height of 30 learners are given below. Fill in the grouped data below. (Tally is a convenient way to count in 5’s. We use llll to indicate 5.)
2. An experiment was conducted in class and 50 learners were asked to guess the number of sweets in a jar. The following guesses were recorded.
A Draw up a grouped frequency table using intervals 11-20, 21-30, 31-40, etc.
Other Examples
Intruction: Choose the one correct answer for each question.
1. the number of visitors who visit Central Park New York in a week is presented in the following table.
The number of visitors on Thursday is ….
A. 340 B. 240 C. 140 D. 490 E. 950
Key: A
2. the following data is the list of the number of candy in 19 pockets, 27, 29, 28, 30, 29, 27, 27, 29, 28, 29, 27, 30, 29, 28, 27, 28, 29, 29, 27.
If data are presented by this table
Then the value of a is equal to ….
A. 2 B. 4 C. 6 D. 7 E. 8
Key: C
Intruction: Solve the following problems clearly and correctly.
3. The following data is the listmathematic exam scores of 25 students in 1st grade senior high school.
Make a frequency table of that data.
Solution:
4. A student in New York do a survey to his 35 friends about the way they get to school everyday. His friends are asked to write K for they who walk, M for they who go by car, S for they who go by motorcycle, B for they who go by public transportation. Below is the result.
statistics,presenting data, presenting data in frequency tables – statistics https://mathlibra.com/presenting-data-in-frequency-tables-statistics/mathlibra.com