A. Topic Overview
● An understanding of statistics is an important life skill. Studying statistics develops critical thinking and analytic skills.
● For any learners planning tertiary education, research will form part of their course. This would be difficult without the use of statistics.
B. Sequential Table
GRADE 8 & 9
GRADE 10
GRADE 11 & 12
● Collect data
● Pose questions relating to social, economic, and environmental issues
● Select and justify appropriate sources for the collection of data
● Distinguish between samples and populations
● Organise numerical data in different ways to summarize by determining measures of central tendency, measures of dispersion, including extremes and outliers
● Organize data according to more than one criteria
● Critically read, interpret and analyse data
● Critically compare two sets of data related to the
same issue.
Collect, organise and interpret univariate numerical data to determine:
● Measures of central tendency in grouped and ungrouped data
● Estimated mean of grouped data
● Modal interval and interval in which median lies
● Five number summary
● Box and whisker diagrams
● Measures of dispersion to include range, percentiles, quartiles, interquartile range and semi-interquartile range
● Use the statistical summaries to interpret, analyse and make meaningful comments on the context associated with the given data.
● Histograms
● Frequency polygons
● Ogives
● Variance and standard deviation of ungrouped data
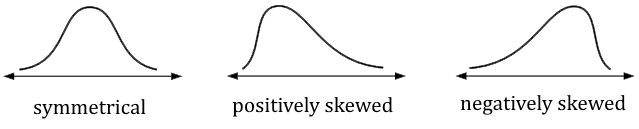
● Symmetric and skewed
data
● Identification of outliers
● Represent bivariate numerical data as a scatterplot
● Calculate the linear regression line which best fits the given data
● Calculate the correlation coefficient and make relevant deductions which include interpolation, extrapolation and discussions on skewness.
C. Statistical Vocabulary
Be sure to teach the following vocabulary at the appropriate place in the topic:
Term
Explanation
data
Facts or information collected from people or objects. Data is plural for datum
population
he entire group of people or objects that data is being collected from
sample
A smaller part of the population. We study a sample if the population is large
random sampling
A method of choosing a smaller sample of the population that tries to ensure that each item has an equal probability of being chosen (not biased)
questionnaire
A set of questions with a choice of answers used in the data collection process
survey
The collecting of data from a group of people
discrete data
Data that can only take certain values. For example, the number of learners in a class (there can’t be half a learner)
continuous data
Data that can take on any value within a certain range. For example, the heights of a group of learners (heights could be measured in decimals)
tally
Away of keeping count by drawing marks. Every fifth mark is drawn across the previous four (to form a gate-like diagram) so you can easily see groups of five
frequency table
A table that lists a set of scores and their frequency. Often used with tallies. Summarises the totals and shows how often something has occurred
measures of central tendency
A measure of central tendency is a single value that describes the way in which a group of data cluster around a central value. Central tendency is a way to describe the centre of a data set. There are three measures of central tendency: mean, median, and mode
mean
The average of a set of numbers. Calculated by adding all the values then dividing by how many numbers there are
median
The middle number in a sorted list of numbers. To find the median, place all numbers in order from smallest to biggest (or biggest to smallest) and find the middle number
mode
The number that appears the most often in a set of data. There can be two modes. There could also be no mode in a set of data
modal class
The class interval that has the most results
estimated mean
An estimated mean can be determined for grouped data.
Unlike listed data, the individual values for grouped data are not available, and you are not able to calculate their sum. To calculate the mean of grouped data, the first step is to determine the midpoint of each interval, or class. These midpoints must then be multiplied by the frequencies of the corresponding classes. The sum of the products divided by the total number of values will be the value of the mean
measures of dispersion
Measures of dispersion indicate the spread of scores in a data set. Examples of measures of dispersion: range, percentiles and quartiles. Such as central tendency, measures of dispersion help to summarise a set of data with one, orjust a few, numbers
range
The difference between the highest and lowest value in a set of data
percentiles
● Each of the 100 equal groups into which a population can be divided according to the distribution of values of a variable
● The value below which a percentage of data falls
quartiles
● Each of four equal groups into which a population can be divided according to the distribution of values of a variable
● The values that divide a list of numbers into quarters
interquartile range (IQR)
● A measure of variability, based on dividing a data set into quartiles. Quartiles divide a rank-ordered data set into four equal parts
● The values that divide each part are called the first, second, and third quartiles; and they are denoted by Q1, Q2, and Q3 respectively
histogram
A graph representing grouped data. The data set is continuous. For example, one bar could represent how many learners got a mark from 40-49 and the next bar would then represent the marks from 50-59
class interval
The size of each class into which a range of a variable is divided, as represented by the divisions on a histogram or bar chart
broken line graph
A graph that uses points connected by lines to show how something changes in value as time goes by or as something else happens
scatter plots
A graph in which the values of two variables are plotted along two axes. The pattern of the resulting points reveals whether there is any correlation between the two sets of values
outlier
An extreme value which is much higher or much lower than the other values
ungrouped data
Data that has not been classified or has not been subdivided in the form of groups. Ungrouped data is raw data. Ungrouped data is in the form of a list of numbers
grouped data
Data that has been ordered and sorted into groups called classes. Data that has been bundled together in categories. Histograms and frequency tables can be used to show this type of data
modal class
● The modal class is the class with the highest frequency from a set of grouped data
● The interval with the most “members”
five-number summary
● Lowest value, lower quartile, median, upper quartile and highest value from a set of data
● The five numbers are used to draw a box and whisker plot
box and whisker plot
A simple way of representing statistical data on a plot in which a rectangle is drawn to represent the second and third quartiles, usually with a vertical line inside to indicate the median value. The lower and upper quartiles are shown as horizontal lines on either side of the rectangle. The lowest value and highest value in the data set are represented at each end
D. Useful Terms
1. Limit of the Class
The starting and end values of each class are called Lower and Upper limit.
2. Class Interval
The difference between upper and lower boundary of a class is called class interval or size of the class.
3. Primary and Secondary Data
The data collected by the investigator himself is known as the primary data, while the data collected by a person, other than the investigator is known as the secondary data.
4. Variable or Variate
A characteristics that varies in magnitude from observation to observation. e.g., weight, height, income, age, etc, are variables.
5. Frequency
The number of times an observation occurs in the given data, is called the frequency of the observation.
6. Discrete Frequency Distribution
A frequency distribution is called a discrete frequency distribution, if data are presented in such a way that exact measurements of the units are clearly shown.
7. Continuous Frequency Distribution
A frequency distribution in which data are arranged in classes groups which are not exactly measurable.
8. Cumulative Frequency Distribution
Suppose the frequencies are grouped frequencies or class frequencies. If however, the frequency of the first class is added to that of the second and this sum is added to that of the third and so on, then the frequencies, so obtained are known as cumulative frequencies (cf).
E. Key Statistical Concepts
In statistics we collect information about a group of individuals, then analyse this information to draw conclusions about those individuals.
You should already be familiar with these words which are commonly used in statistics:
● Population – an entire collection of individuals about which we want to draw conclusions
● Census – the collection of information from the Whole population
● Sample – a subset of the population which should be chosen at random to avoid bias in the results
● Survey – the collection of information from a sample
● Data – information about individuals in a population
● Categorical Variable – describes a particular quality or characteristic which can be divided into categories
● Numerical variable – describes a characteristic which has a numerical value that can be counted or measured
● Parameter – a numerical quantity measuring some aspect of a population
● Statistic – a quantity calculated from data gathered from a sample, usually used to estimate a population parameter
● Distribution – the pattern of variation of data, which may be described as:
● Outliers – data values that are either much larger or much smaller than the general body of data; they should be included in analysis unless they are the result of human or other known error


")
")

 (10 Examples)")

