The median of a distribution is the value of the middle variable when the variables are arranged in ascending or descending order.
Median (Md) is an average of position of the numbers.
1. Median for Simple Distribution
Firstly, arrange the terms in ascending or descending order and then find the number of terms n.
(a) If n is odd, then (½n)th term is the median.
(b) If n is even, then there are two middle terms namely (½n)th and (½n+1)th terms. Hence, median equals mean of (½n)th and (½n+1)th terms.
2. Median for Ungrouped Frequency Distribution
(i) First find ½N, where N=Σfi.
(ii) Find the cumulative frequency of each value of the variable and take value of the variable which is equal to or just greater than ½N
(iii) This value of the variable is the median.
3. Median for Grouped Data (Median Class)
If in a continuous distribution, the total frequency be N, then the class whose cumulative frequency is either equal to ½N or is just greater than ½N is called median class.
For a continuous distribution, median
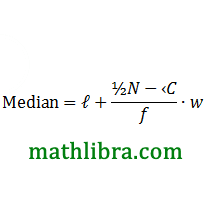
where, ℓ= lower boundary of the median class
f= frequency of the median class
N= total frequency =Σf
‹C= cumulative frequency of the class just before the median class
w= width of the median class
Median is a value which divides the distribution into two equal parts. It is a middle most value in the distribution. It is the value which exceeds and exceeded by the same number of observations. It is also known as 2nd quartile (Q2). It is a positional average.
For ungrouped data
(a) If the number of observations is odd then the median is the middle most value when the observations are arranged in the ascending / descending order of their magnitudes*.
(b) If the number of observations is even then the median is the average of two middle most values when the observations are arranged in the ascending / descending order of their magnitudes*.
OR
Median =((n+1)/2)th term in the arrayed series*
For grouped data (discrete frequency distribution)
Median =((n+1)/2)th term, where N=Σf
For grouped data (continuous frequency distribution)

ℓ: lower boundary of the median class (median class is the class which contains median: it is the class corresponding to lower cumulative frequency (LCF) just)
N: Total frequency
‹C: Cumulative frequency preceding to median class
w: Width of the median class
f: Frequency corresponding to median class
Note: To calculate median in case of continuous frequency distribution, the class intervals should be of exclusive type.
Merits:
● It is rigidly defined
● It is easy to understand and calculate; some times it can be obtained by inspection.
● It is considered as one of the suitable averages in case of frequency distribution with open end class intervals.
● It can be located graphically.
Demerits:
● In case of even number of observations median is merely estimated as the average of two middle most values.
● It is not based on all observations
● It is not suitable for further algebraic treatment
From Grouped Data
1. Find out the median using ½N
2. Find out the class in which median lies
3. Apply the formula

ℓ= Lower boundary of the median class
N= total frequency =Σf
f= Frequency of median class
‹C= Cumulative frequency of the preceding median class
w= Class interval of the median class
Calculation of Median from Group Data
Example 1. Calculation Of median from the previous data table:
Necessary calculation for finding median.

Here ½N=40, So median lies in the 21-23 class.
Previous cumulative frequency is (‹C). 8+31=39.
Lower boundary of the class where median lies is (ℓ).

Locating Median Graphically,

Median for grouped data: Two-step procedure
Step 1: identify the median class, which is the class that contains the number on the ½n position.
Step 2: Estimate the median value within the median class using the following formula:

where
ℓ is the lower boundary of the median class
‹C is the cumulative frequency before the median class
f is the frequency of the median class
w is the class interval or size
Example 2. A weight table contains the following data

Example 3. Let us find out the median of this data table:

(i). The median is the middle number.

| Symbol | Definition |
|---|---|
| ℓ | lower boundary of the median’s class |
| ‹𝐶 | cumulative frequency before the median’s frequency |
| 𝑤 | class interval (width) |
| 𝑓 | median’s frequency |
(ii). Use ½𝑛 to determine the location of the middle frequency.
(iii). Beginning at the top of the frequency distribution and counting down the frequency column reveals that the 7.5 frequency is located in the third class from the top (or bottom for that matter). The lower boundary of the median’s class is 69.5 and the class is 10 wide.

Example 4. Weight of 60 apples picked out at random from a consignment to the nearest grams: Let us find out the median of this raw data set:
111 92 86 70 126 68 130 129 139 119 115 128
100 186 184 99 113 204 111 144 136 123 90 115
98 110 78 185 162 178 140 152 173 146 158 194
148 90 107 181 131 75 184 104 110 80 118 82
Table for the Calculation of Median:
| Weight | Class-Boundaries | Number of Apples (f) | Cumulative Frequency |
|---|---|---|---|
| 65-84 | 64.5-84.5 | 9 | 9 |
| 85-104 | 84.5-104.5 | 10 | 19 |
| 105-124 | 104.5-124.5 | 17 | 36 |
| 125-144 | 124.5-144.5 | 10 | 46 |
| 145-164 | 144.5-164.5 | 5 | 51 |
| 165-184 | 164.5-184.5 | 4 | 55 |
| 185-204 | 184.5-204.5 | 5 | 60 |
| Total | 60 |
Median is ½nth observation i.e 60/2 = 30th observation.
While observing cumulative frequency column in the above table we find that 105 – 124 is the median class, it means median lies between 105 – 124.
The formula to calculate median is:

• ℓ is lower boundary of the median class = 104.5
• w is the size/ width of median class = 20
• f is the frequency of median class = 17
• ‹C is the cumulative frequency lower than the median class = 19
• N is the total no: of observations in the distribution = 60Put these values in the formula
Similarly! Quartiles, Deciles and Percentiles can be calculated from the data:
Q1 is 60/4 th item i.e 15th observation. While observing cumulative frequency column
in the above table we find that 85 – 104 is the Q1 class.

• ℓ is lower boundary of the Q1 class = 84.5
• w is the size/ width of Q1 class = 20
• f is the frequency of Q1 class = 10
• ‹C is the cumulative frequency preceding the Q1 class = 9
• N is the total no: of observations in the distribution = 60
Similar usage for deciles (D) and percentiles (P).

Let’s read post Calculation of Median for Grouped Data.


 (Measures of Central Tendency)")