probabilities,advanced probability, using a 3 circle venn diagram to calculate probability https://mathlibra.com/using-3-circle-venn-diagram-to-calculate-probability/
Using a 3 Circle Venn Diagram to Calculate Probability
Read Data in a Venn Diagram
📌 Example 1. A survey is conducted with a group of 50 learners to find out what is more popular at the school tuckshop. They are asked if they usually buy toasted sandwiches (T), salads (S) or burgers (B).
They can choose none, one, two or three of the meals.
The survey results are shown with this Venn diagram:
a) How many people did not buy salads, toasted sandwiches or burgers?
b) Calculate the probability that a learner selected at random from this survey:
i) buys salad, but not toasted sandwiches or burgers.
ii) buys toasted sandwiches and salad, but not burgers.
iii) buys salad or burgers or both, but not toasted sandwiches.
✍ Solution:
a) 50-(15+2+10+1+3+5+4)=50-40=10
10 learners bought none of the items listed.
Draw a Venn Diagram
📌 Ex2. Thobeka compares three neighbourhoods (we’ll call them A, B and C) to see where the best place is to live. She interviews 80 people and asks them whether they like each of the neighbourhoods, or not.
● 40 people like neighbourhood A.
● 35 people like neighbourhood B.
● 40 people like neighbourhood C.
● 21 people like both neighbourhoods A and C only.
● 18 people like both neighbourhoods B and C only.
● 68 people like at least one neighbourhood.
● 7 people like all three neighbourhoods.
a) Use this information to draw a Venn diagram.
b) How many people like none of the neighbourhoods?
c) How many people like neighbourhoods A and B, but not C?
d) What is the probability that a randomly chosen person from the survey likes at least one of the neighbourhoods?
✍ Solution:
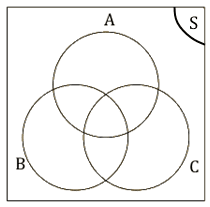
a) We first draw the outline of the Venn diagram.
Next, we determine the counts of the different regions in the diagram, using the information provided.
● There are 7 people who like all three neighbourhoods, so n(A and B and C)=7.
● There are 21 people who like A and C, so n(A and C)=21.
● There are 18 people who like B and C, so n(B and C)=18.
● There are 40 people who like C. so n(C)=40.
● Since 68 people like at least one neighbourhood and since there are 80 people in total, 12 people like none of the neighbourhoods.
Using the above information we can complete part of the Venn diagram.
Since n(A or B or C)=68, we can see from the diagram above that n(A or B)=60. From the sum rule
n(A and B)=n(A)+n(B)-n(A or B)
=40+35-60=15
This allows us to complete the diagram:
Finding Necessary Variables
📌 Ex3. There are 71 Grade 10 learners at school. All of these take some combination of Maths, Geography and History. The number who take Geography is 41, those who take History is 36, and 30 take Maths. The number who take Maths and History is 16; the number who take Geography and History is 6, and there are 8 who take Maths only and 16 who take History only.
a) Draw a Venn diagram to illustrate all this information.
✍ solution:
We are told that 16 learners take Maths and History. Out of these 16 learners some take Geography as well and some do not.
We are also told that 6 learners take Geography and History. Out of these 6 learners some take Maths as well and some do not.
Let the number of learners who take Maths, History and Geography =x. Then we can draw the Venn diagram as follows:
b) How many learners take Maths and Geography but not History?
✍ solution:
In the above Venn diagram the number of learners who take Maths and Geography but not History is indicated by y. To find y we first need to determine x.
To find x we note that the total number of learners who take History is equal to the sum of each ofthe following:
● The number of learners who take History only: 16
● The number of learners who take History and Maths but not Geography: 16-x
● The number of learners who take History and Geography but not Maths: 6-x
● The number of learners who take all three subjects: x
36=16+(16-x)+(6-x)+x
=16+16-x+6-x+x
=38-x∴x=2
Now we can find y using the same method as to find x. This time we will use the total number of learners who take Maths.
30=8+(16-x)+x+y
=8+14+2+y
=24+y∴y=6
Therefore 6 learners take Maths and Geography but not History.
c) How many learners take Geography only?
✍ solution:
Now we need to find z. We will use the total number of learners who take Geography to find z.
41=(6-x)+x+y+z
=4+2+6+z
=12+z∴z=29
Therefore 29 learners take Geography only.
d) How many learners take all three subjects?
✍ solution:
When we drew the Venn diagram we let x be the number of learners that take all three subjects. We calculated x in the first question. Therefore 2 learners take all three subjects.
Enrichment:
💪 Let you read How can we Calculate Probabilities with a Three-Set Venn Diagram? 💡
probabilities,advanced probability, using a 3 circle venn diagram to calculate probability https://mathlibra.com/using-3-circle-venn-diagram-to-calculate-probability/