⚠ Pay attention to every underlined singular noun just on this page!
EXAMPLES
📌 Ex1. S={a;b;c;d;e;f;g;h;i;j} and A={a;e;i), B={b;c;d;f;g;h}, C={b;h;j}.
(a) Draw a Venn diagram to represent S.
(b) Give a description of set A.
(c) Are there any complementary sets? Explain.
(d) Which sets are mutually exclusive, but they are not complementary? Give a reason for your answer.
✍ Solution:
(a)
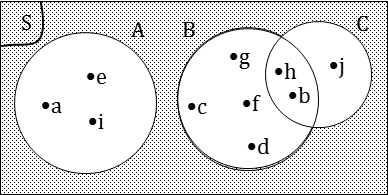
(b) Set A is the set of vowels from a to j; or the set of the first three vowels of the alphabet.
(c) Sets A and B are not complementary because they do not include element j. Sets A and C are also not complementary.
(d) Sets B and C share elements b and h, so they are not mutually exclusive or complementary. Set A and set B are mutually exclusive, but they are not complementary.
📌 Ex2. The last ten letters of the alphabet are placed in a hat and people are asked to pick one of them. Event D is picking a vowel, event E is picking a consonant and event F is picking one of the last four letters. Draw a Venn diagram showing the outcomes in the sample space and the different events. Then calculate the following probabilities:
(a) P(not F) (b) P(F or D) (c) P(neither E nor F)
(d) P(D and E) (e) P(E and F) (f) P(E and D̄)
✍ Solution:
(a) The Venn diagram is shown below. (Note that Y is not a vowel.)
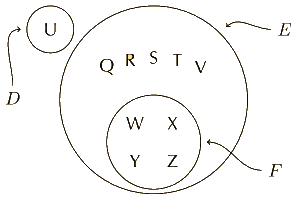
We can then read off all the required probabilities.
(b) 5/10=½
(c) This leaves only the outcomes in D, so P(neither E nor F)=1/10.
(d) 0 since D and E are mutually exclusive.
(e) 4/10=⅖
(f) Since D and E are complementary (a letter is either a vowel or a consonant), D̄=E, so P(E and D̄)=P(E and E)=P(E)=9⁄10.
📌 Ex3. The following shows the results of a survey on the types of exercise taken by a group of 100 people.
| 65 run, 48 swim, 60 cycle, 40 run and swim, 30 swim and cycle, 35 run and cycle 25 do all three |
(a) Draw a Venn diagram to represent this information.
(b) Work out the probability that a randomly selected person from the survey
(i) takes none of these types of exercise (ii) swims but does not run
✍
NOTE: Always start from the overlap and then work your way outwards to complete the Venn diagram. In this case all of them overlap. We need to draw three overlapping circles. Always label your circles.
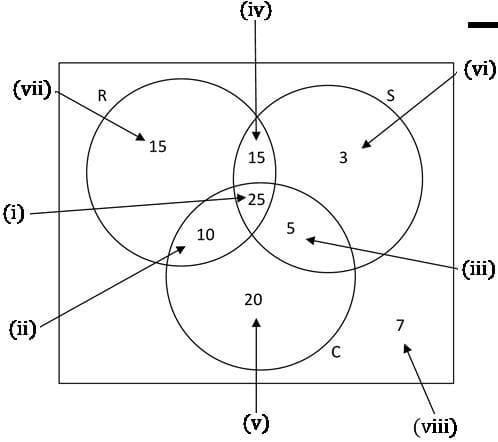
(i). All three overlap.
(ii). 35 run and cycle but we already have 25 which run and cycle so another 10 run and cycle.
(iii). 30 swim and cycle but we already have 25 which swim and cycle so another 5 swim and cycle.
(iv). 40 run and swim but we already have 25 which run and swim so another 15 run and swim
(v). 60 cycle but we already have 10, 25 and 5 which cycle so another 20 cycle. NOTE: The circle which represents cycle adds up to 60.
(vi). 48 swim but we already have 15, 25 and 5 which swim so another 3 swim. NOTE: The circle which represents swim adds up to 48.
(vii). 65 run but we already have 15, 25 and 10 which run so another 15 run. NOTE: The circle which represents run adds up to 65
(viii). This section represents a person who does not run, swim or cycle so
100–(15+15+25+10+3+5+20)=7.
(b) (i) none of these types of exercise =7 ←[7 is not in any of the circles]
probability none of these types of exercise =7⁄100 ←[There are 100 people in total]
(b.ii) swims but does not run =3+5=8 ←[In circle S but not in circle R]
probability swims but does not run =8⁄100.
📌 Ex4. A group of 100 students were surveyed to find out whether they drank tea (T), coffee (C), or a soft drink (D) at any time in the previous week.

These are the results:
| 24 had not drunk any of the three 51 drank tea or coffee, but not a soft drink 41 drank tea 8 drank tea and a soft drink, but not coffee 9 drank a soft drink and coffee 20 drank at least two of the three 4 drank all three. |
(a) Represent the above information on the Venn diagram.
✍
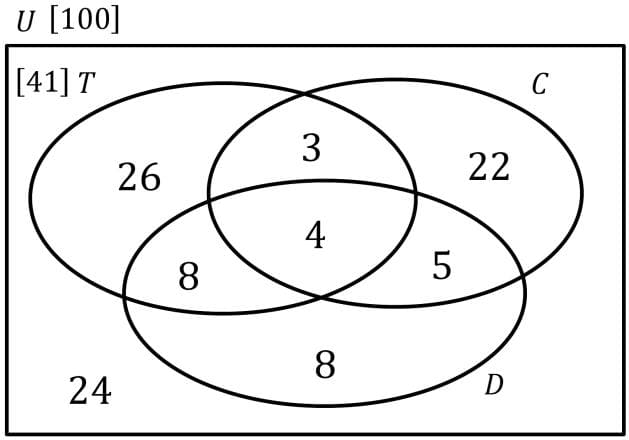
At least two includes the sections of the Venn Diagram that are exactly 2 as well as the section that includes all 3.
51 drank tea or coffee, but not a soft drink.
The amount in D but not in C or T.
(b) Find the probability that a student chosen at random from the group had drunk tea or coffee.
✍
Find the probability that a student chosen at random from the group had drunk tea and coffee but not a soft drink.

📌 Ex5. A survey was conducted among 100 Grade 12 learners about their use of Instagram (I), Twitter (T) and WhatsApp (W) on their cell phones. The survey revealed the following:
| • 8 use all three. • 12 use Instagram and Twitter. • 5 use Twitter and WhatsApp, but not Instagram. • x use Instagram and WhatsApp, but not Twitter. • 61 use Instagram. • 19 use Twitter. • 73 use WhatsApp. • 14 use none of these applications. |
(a) Draw a Venn diagram to illustrate the information above.
(b) Calculate the value of x.
(c) Calculate the probability that a learner, chosen randomly, uses only ONE of these applications.
✍ Solution:
(a)

(b)
–x+142=100
x=42
(c) P(use only one application)
=(7+2+18)⁄100=27⁄100=27%
QUESTIONS and ANSWERS
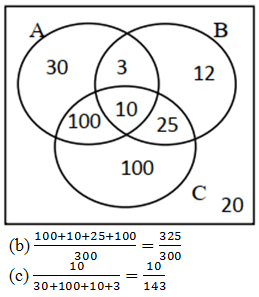
Q1. A person’s blood group is determined by whether or not it contains any of 3 substances A, B and C. A doctor surveyed 300 patients‘ blood and produced the table below.
| Blood contains | Number of patients |
|---|---|
| Only C | 100 |
| A and C but not B | 100 |
| Only A | 30 |
| B and C but not A | 25 |
| Only B | 12 |
| A, B and C | 10 |
| A and B but not C | 3 |
(a) Draw a Venn diagram to show this information.
(b) Find the probability that a randomly chosen patient‘s blood contains substance C.
(c) Harry is one of the patients. Given that his blood contains substance A, find the probability that his blood contains all 3 substances.
🔑 (a)
Q2. The following shows the results of a juice tasting survey of 100 people.
| 96 like apple juice 93 like orange juice 96 like mango juice 92 like apple juice and orange juice 91 like orange juice and mango juice 93 like apple juice and mango juice 90 like all three |
(a) Draw a Venn diagram to represent this data.
(b) Find the probability that a randomly selected person from the survey likes
(i) none of the three juices, (ii) apple juice but not orange juice.
(c) Given that a person from the survey likes apple juice, find the probability that the person likes mango juice.
🔑 (a)

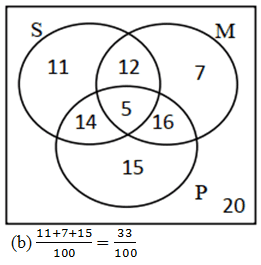
Q3. In a group of 100 students
| 42 study Statistics 40 study Mathematics 50 study Physics 21 study Mathematics and Physics 19 study Statistics and Physics 17 study Statistics and Mathematics 5 study all three |
(a) Draw a Venn diagram to represent this information.
(b) One of the students is picked at random. Find the probability that this student studies only one of these subjects.
🔑 (a)
PIC10
Enrichment:
💪 How can we Calculate Probabilities with a 3-Set Venn Diagram? 💎


