probabilities,probability,set operations and venn diagrams, how can we calculate probabilities with a 3-set venn diagram? https://mathlibra.com/how-can-we-calculate-probabilities-with-a-3-set-venn-diagram/
How can we Calculate Probabilities with a 3-Set Venn Diagram?
⚠ Pay attention to every yellow-highlighted singular noun just on this page!
EXAMPLES
📌 Ex1. Charles asked 100 people which of the films Ghost, Titanic and Shrek they have watched. Here is some information about his results.
55 had watched Ghost.
58 had watched Titanic.
60 had watched Shrek.
36 had watched Ghost and Shrek.
35 had watched Ghost and Titanic.
37 had watched Titanic and Shrek.
20 had watched all three films.
(a) Draw a Venn diagram to show this information.
(b) Charles picks, at random, one of these 100 people. Given that the person had watched Titanic, work out the probability that this person had also watched Ghost.
✍
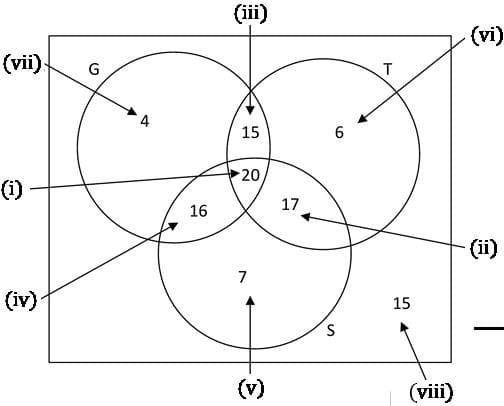
(a)
Fill in the numbers on the Venn diagram in the order shown below …, i.e. starting with 20 watching all 3 films.
(i). All three overlap.
(ii). 37 had watched Titanic and Shrek but we already have 20 who have watched all three so need another 17 who have watched Titanic and Shrek.
(iii). 35 had watched Ghost and Titanic but we already have 20 who have watched all three so need another 15 who have watched Ghost and Titanic.
(iv). 36 had watched Ghost and Shrek but we already have 20 who have watched all three so need another 16 who have watched Ghost and Shrek.
(v). 60 had watched Shrek but we already have 16, 20 and 17 who have watched Shrek so need another 7 who watch Shrek only. Note: The circle which represents Shrek adds up to 60.
(vi). 58 had watched Titanic but we already have 15, 20 and 17 who have watched Titanic so need another 7 who watch Titanic. Note: The circle which represents Titanic adds up to 58.
(vii). 55 had watched Ghost but we already have 15,20 and 16 who have watched Ghost so need another 4 who watch Ghost. Note: The circle which represents Ghost adds up to 55.
(viii). This section represents a person who does not run, swim or cycle so
100-(20+15+16+17+4+6+7)=15
(b) Number who watched Titanic=58 ←[ Given watched Titanic so look at the Titanic circle only]
Of these 58, 15+20=35 had also watched Ghost. ←[ Look at the overlap of G and T]
Probability that this person had also watched Ghost =35⁄58.
📌 Ex2. A researcher has found old census data about Measles (M), Chickenpox (C), and Whooping cough (W) among 12-year-old children. In a group of 100 children:
31 had none of these diseases
2 had all three diseases
2 had Measles and Chickenpox, but not Whooping cough
6 had Whooping cough and Chickenpox
11 had at least two diseases
18 had Measles
40 had Chickenpox.
(a) Use this data to fill in the Venn diagram.
✍
At least two includes the sections of the Venn Diagram that are exactly 2 as well as the section that includes all 3.
100-(18+32+4+31)=15
(b) Find the probability that a child chosen at random from the group had Chickenpox.
✍
P(Chickenpox)=40⁄100
=⅖
(c) Complete the table.
English
Set notation
Statement 1
6 had Whooping cough and Chickenpox
….
6=n(W∩C)
Statement 2
….
36 had Chickenpox but not Measles
36=n(C\M)
Statement 3
2 had Measles and Chickenpox but not Whooping cough
….
2=n[(M∩C)\W]
📌 Ex3. A survey of 80 participants at the 2019 Olympic Games was taken. Athletes’ participation was recorded as follows:
• 44 participated in swimming:
• 33 participated in gymnastics;
• 39 participated in athletics:
• 23 participated in both swimming and athletics;
• 19 participated in both gymnastics and athletics;
• 9 participated in all three events:
• 69 participated in at least one event and
• 11 participants remained as reserves for the events (did not participate).
(a) Let the number of participants in both swimming and gymnastics, but not in athletics, be represented by x. Draw a Venn diagram to represent the survey.
(b) Hence show that x=5.
(c) What is the probability that a participant chosen at random will participate in at least two of the three events.
✍ Solution:
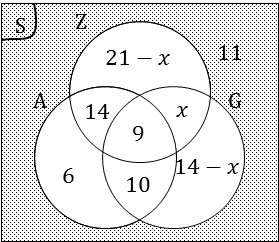
(a) Let Z represent the participants for swimming; G represent the gymnastics participants and A for the athletics participants.
(b) 21-x+x+14-x+9+14+10+6+11=80
85-x=80→x=5
(c) P(participants in at least 2 events)
=(5+14+10+9)÷80=0.475
📌 Ex4. A school organised a camp for 103 Grade 12 learners. The learners were asked which food they prefer for the camp.
They had to choose from chicken (C), vegetables (V) and fish (F).
The following information was collected:
• 2 learners do not eat chicken, fish or vegetables
• 5 learners eat only vegetables
• 2 learners only eat chicken
• 21 learners do not eat fish
• 3 learners eat only fish
• 66 learners eat chicken and fish
• 75 learners eat vegetables and fish
Let the number of learners who eat chicken, vegetables and fish be x.
(a) Draw a Venn diagram to represent the information.
(b) Calculate x.
(c) Calculate the probability that a learner, chosen at random:
(i) Eats only chicken and fish, and no vegetable.
(ii) Eats any TWO of the given food choices: chicken, vegetables and fish.
✍ Solution:
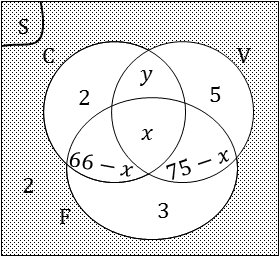
(a) The Venn diagram:
Fill in any given information that you can.
We do not know where these belong yet:
• 21 learners do not eat fish
• 66 learners eat chicken and fish
So let x be learners who eat chicken, fish and vegetables.
Then 66-x is learners who eat only chicken and fish.
Introduce y, the learners who do not eat fish, but do eat chicken and vegetables.
Then 2+y+5+2=21,∴y=12
📌 Ex5. 30 learners were surveyed and the following information was revealed from this group:
● 18 learners take Geography
● 10 learners take French
● 6 learners take History, but take neither Geography nor French.
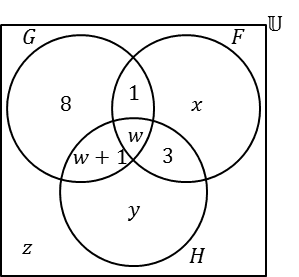
ln addition the following Venn Diagram has been filled in below:
Let G be the event that a learner takes Geography.
Let F be the event that a learner takes French.
Let H be the event that a learner takes History.
(a) From the information above, determine the values of w, x, y and z.
✍ Solution:
y=6
8+(w+1)+w+1=18
2w=18-10→w=4
10=x+1+w+3
10=x+8 x=10-8=2
z=30-(8+1+w+w+1+x+3+y) z=30-(13+8+2+6) z=30-29=1
Therefore w=4, x=2, y=6 and z=1.
(b) Determine the probability that a learner chosen at random from this group:
(i) takes only Geography.
(ii) takes French and History, but not Geography.
✍ Solution:
QUESTIONS and ANSWERS
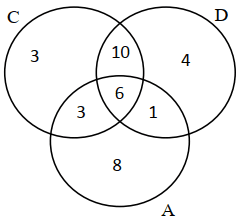
Q1. All the members of a group of 35 students belong to at least one club. There are 3 clubs: chess, drama and art.
8 of the students belong to only the art club
6 of the students belong to all 3 clubs
3 of the students belong to the chess and art clubs but not to the drama club
18 of the students belong to the art club
3 of the students belong only to the chess club
4 of the students belong only to the drama club
(a) Work out the probability that a student belongs to the chess club and to the drama club but not to the art club?
(b) Work out the probability that a student belongs to the chess club.
🔑 (a) 10⁄35
(b) 22⁄35
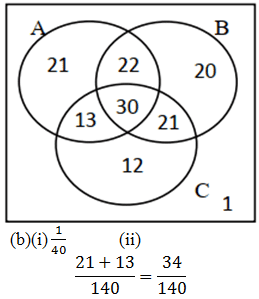
Q2. 140 people were asked in a tasting survey to say which, if any, of three cakes they liked. Here are the results.
86 people liked cake A
93 people liked cake B
76 people liked cake C
52 people liked cakes A and B
51 people liked cakes B and C
43 people liked cakes A and C
30 people liked all three cakes.
(a) Draw a Venn diagram to show this information.
(b) A person is chosen at random from those who took part in the survey.Find the probability that this person
probabilities,probability,set operations and venn diagrams, how can we calculate probabilities with a 3-set venn diagram? https://mathlibra.com/how-can-we-calculate-probabilities-with-a-3-set-venn-diagram/