A Venn diagram is a graphical way of representing the relationships between sets. In each Venn diagram a set is represented by a closed curve. The region inside the curve represents the elements that belong to the set, while the region outside the curve represents the elements that are excluded from the set.
Venn diagrams are helpful for thinking about probability since we deal with different sets. Consider two events, A and B, in a sample space S. The diagram below shows the possible ways in which the event sets can overlap, represented using Venn diagrams:

The sets are represented using a rectangle for S and circles for each of A and B. In the first diagram the two events overlap partially. In the second diagram the two events do not overlap at all. In the third diagram one event is fully contained in the other. Note that events will always appear inside the sample space since the sample space contains all possible outcomes of the experiment.
Venn diagrams are used to visually represent the sample space of an experiment and the relationship between the events in the sample space.
Remember: The sample space contains all the possible outcomes of an event.
We use Venn diagrams to help us to represent different events. Venn Diagram consists of circles and a rectangle
The rectangles S represents the sample space (all of the possible outcomes). Each circle inside S represents a different event.
If the two circles intersect, the intersection shows which outcomes belong to both events.
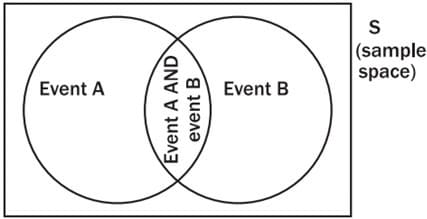
Q1. On separate Venn diagrams containing two events A and B that intersect, shade the region representing:
a) in A but not in B b) neither in A nor B.
answer:
Shading is shown in green.
a)

b)

Q2. For each of the following, draw a Venn diagram to represent the situation and find an example to illustrate the situation.
a) a sample space in which there are two events that are not mutually exclusive
answer:

An example is drawing a card from deck of cards. We can draw a red card that is also a picture card.
b) a sample space in which there are two events that are complementary
answer:

An example is rolling a die. The event of rolling an even number is complementary to the event of rolling an odd number.
Q3. Pieces of paper labelled with the numbers 1 to 12 are placed in a box and the box is shaken. One piece of paper is taken out and then replaced.
a) What is the sample space, S?
answer:
b) Write down the set A, representing the event of taking a piece of paper labelled with a factor of 12.
answer:
c) Write down the set B, representing the event of taking a piece of paper labelled with a prime number.
answer:
d) Represent A, B and S by means of a Venn diagram.
answer:

e) Find: i. n(S) ii. n(A) iii. n(B)
answer: i. 12 ii. 6 iii. 5
Q4. Let S denote the set of whole numbers from 1 to 16, X denote the set of even numbers from 1 to 16 and Y denote the set of prime numbers from 1 to 16. Draw a Venn diagram depicting S, X and Y.
answer:

Q5. In a box there are pieces of paper with the numbers from 1 to 9 written on them. S={1;2;3;4;5;6;7;8;9}. E denote the set of even numbers from 1 to 9 and P denote the set of prime numbers from 1 to 9
answer:
Step 1: Consider the events:
● Drawing a prime number; P={2,3,5,7}
● Drawing an even number; E={2,4,6,8}
Step 2: Draw a diagram
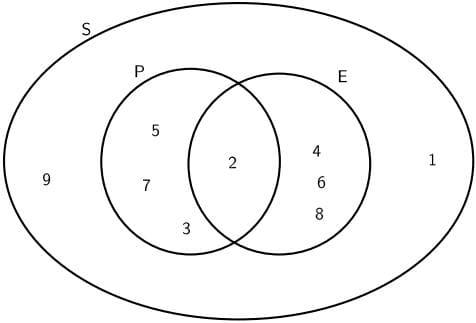
Step 3: Find the union
The union of P and E is the set of all elements in P or in E (or in both). P or E = 2,3,4,5,6,7,8. P or E is also written P∪E.
Step 4: Find the intersection
The intersection of P and E is the set of all elements in both P and E.
P and E =2. P and E is also written as P∩E.
Step 5: Find the number in each set
We use n(S) to refer to the number of elements in a set S, n(X) for the number of elements in X, etc.
∴n(S)=9;n(P)=4;n(E)=4;n(P∪E)=7;n(P∩E)=2;
Q6. Let S denote the set of whole numbers from 1 to 15, X denote the set of even numbers from 1 to 15 and Y denote the set of prime numbers from 1 to 15. Draw a Venn diagram depicting S, X and Y.
answer:

DEFINITION: Union
The union of two sets is a new that contains all of the elements that are in at least one of the two sets. The union is written as A∪B or “A or B”.
DEFINITION: Intersection
The intersection of two sets is a new set that contains all of the elements that are in both sets. The intersection is written A∩B or “A and B”
The figure below shows the union and intersection for different configurations of two events in a sample space, using Venn diagrams.
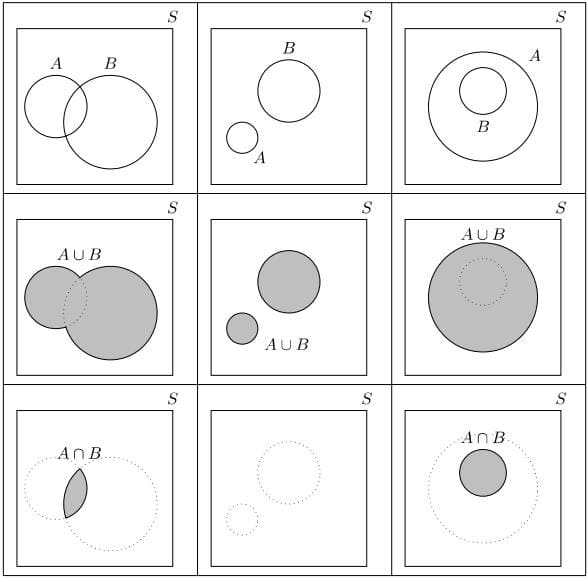
This figure: The unions and intersections of different events. Note that in the middle column the intersection, A∩B, is empty since the two sets do not overlap. In the final column the union, A∪B, is equal to A and the intersection, A∩B, is equal to B since B is fully contained in A.
Q7. If the Venn diagram below illustrates the number of people in a sporting club who play tennis (T) and hockey (H).

Determine the number of people:
a) in the club b) who play hockey c) who play both sports
d) who play neither sport e) who play at least one sport.
answer:
a) Number in the club =15+27+26+7=75
b) Number who play hockey =27+26=53
c) Number who play both sports =27
d) Number who play neither sport =7
e) Number who play at least one sport =15+27+26=68
Venn diagrams are a useful way of representing the events in a sample space. These diagrams usually consist of a rectangle which represents the complete sample space U or S, and circles within it which represent particular events.
Venn diagrams can be used to solve certain types of probability questions and also to establish a number of probability laws.
When we roll an ordinary die, the sample space or universal set is U={1, 2, 3, 4, 5, 6}.
If the event A is “a number less than 3”, then there are two outcomes which satisfy event A. We can write A={1, 2}.

The Venn diagram above illustrates the event A within the universal set U.
n(U)=6 and n(A)=2, so P(A)=n(A)/n(U) =2/6=⅓.
i. The union of two collections, A and B, contains all elements that occur in A or B: Union of A or B =A∪B
ii. The intersection of two collections, A and B, contains all elements that occurs in both A and B: Intersection of A and B =A∩B
iii. Two collections are disjoint if there are no elements belonging to both collections. In other words: n(A∩B)=0.

Mutually exclusive events
In this case, if A happens, B cannot happen, and vice versa.
i. P(A OR B)=P(A)+P(B)
ii. The events cannot both happen at the same time.
iii. The sets of outcomes for the events are disjoint
(have no elements in common). Therefore P(A∩B)=0
iv. P(A∪B)=(n(A)+n(B))/n(S) =P(A)+P(B)
v. n(A∪B)=n(A)+n(B)

i. The universal set or sample space U is represented by a rectangle.
A set within the universal set is usually represented by a circle.

ii. Ᾱ (shaded green) is the complement of A (shaded purple).
Ᾱ represents the non-occurrence of A, so P(A)+P(Ā)=1

If U={1, 2, 3, 4, 5, 6, 7} and A={2, 4, 6} then Ā={1, 3, 5, 7}.
iii. x∈A reads it x in A and means that x is an element of the set A.
iv. n(A) reads ‘the number of elements in set A‘.
v. A∩B denotes the intersection of sets A and B. This set contains all elements common to both sets.

A∩B={x|x∈A and x∈B}
vi. A∪B denotes the union of sets A and B. This set contains all elements belonging to A or B or both A and B.

A∪B={x|x∈A or x∈B or x∈A∩B}
vii. Disjoint sets are sets which do not have elements in common.

These two sets are disjoint. A∩B=∅. Where ∅ denotes the empty set.
A and B are said to be mutually exclusive.
Q8 (esample). Draw a Venn diagram to show the sample space
S={l; 2; 3; 4; 5; 6; 7; 8; 9; 10}
Indicate the following events in the sample space: Event A is the set of prime numbers.
∴ A={2; 3; 5; 7}
Event B is the set of even numbers.
∴ B={2; 4; 6; 8; 10}
Solution

● Both sets have 2 in them, so A and B must intersect.
● Write in 2 first in the intersection.
● Then write in the remaining numbers in each event.
● Check if there are any numbers that are not in Event A or Event B.
● 1 and 9 is part of the sample space, but not in A or in B. Write it in the rectangle, but not in A or B.
Q9. Use the Venn diagram in the previous example to determine:
1. P(A) 2. P(B) 3. P(A and B) 4. P(A or B)
answer:
1. P(A)=4/10=⅖
2. P(B)=5/10=½
3. P(A and B)=1/10
4. P(A or B)=8/10=⅘
Because P(A)+P(B)-P(A and B)=4/10+5/10-1/10=8/10=⅘
Q10. The Venn diagram below represents the set U of all children in a class. Each dot represents a student. The event E shows all those students with blue eyes.

Determine the probability that a randomly selected child:
a) has blue eyes b) does not have blue eyes.
answer:

n(U)=23;n(E)=8
a) P(blue eyes)=n(E)/n(U) =8/23
b) P(not blue eyes)
Or P(not blue eyes) =1-P(blue eyes)
=1-8/23=15/23
Q11. In a class of 30 students, 19 study Physics, 17 study Chemistry, and 15 study both of these subjects. Display this information on a Venn diagram and hence determine the probability that a randomly selected class member studies:
a) both subjects b) at least one of the subjects
c) Physics but not Chemistry d) exactly one of the subjects
e) neither subject
answer:

Let P represent the event of ‘studying Physics’ and C represent the event of ‘studying Chemistry’.
Now a+b=19 {as 19 study Physics}
b+c=17 {as 17 study Chemistry}
b=15 {as 15 study both}
a+b+c+d=30 {as there are 30 in the class}

a) P(studies both) =15/30=0.5
b) P(studies at least one subject) =(4+15+2)/30=0.7
c) P(P but not C) =4/30=0.133
d) P(studies exactly one) =(4+2)/30=0.2
e) P(studies neither) =9/30=0.3
Q12. A survey was conducted among 150 learners in Grade 10 at a certain school to establish
how many of them owned the following devices: smartphone (S) or tablet (T).
The results were as follows:
• 8 learners did not own either a smartphone or a tablet.
• 20 learners owned both a smartphone and a tablet.
• 48 learners owned a tablet.
• x learners owned a smartphone.
a) Represent the information above in a Venn diagram.
b) How many learners owned only a smartphone?
c) Calculate the probability that a learner selected at random from this group:
(i) Owned only a smartphone
(ii) Owned at most one type of device
answer:
a)

b) x-20+20+28+8=150
Smartphone only =114-20=94
c) (i) P(S only)=94/150=0.63
c) (ii) P(S or T or neither)=94/150+28/150+8/150=130/150=13/15=0.87
Q13. In a certain class of 42 boys:
• 27 play hockey (H)
• 32 play soccer (S)
• 7 do not play hockey or soccer
• An unknown number (x) play both hockey and soccer
The information is represented in the Venn diagram below.

a) Calculate the value of x.
b) If a boy from the class is chosen at random, calculate the probability that he:
(i) Does not play hockey or soccer
(ii) Plays only soccer
answer:
a) 17-x+x+32-x+7=42
x=24
b) (i) P(does not play hockey or soccer)
b) (ii) P(soccer only)
OR
Q14. At a certain school there are 64 boys in Grade 10. Their sport preferences are indicated below:
• 24 boys play soccer
• 28 boys play rugby
• 10 boys play both soccer and rugby
• 22 boys do not play soccer or rugby
a) Represent the information above in a Venn diagram.
b) Calculate the probability that a Grade 10 boy at the school, selected at random, plays:
(i) Soccer and rugby
(ii) Soccer or rugby
answer:
a)

b) (i) P(Soccer and Rugby)=10/64=5/32=0.15625=15.63%
b) (ii) P(Soccer or Rugby)=(14+10+18)/64=42/64=21/32=0.65625=65.63%
OR
P(Soccer or Rugby)=1-22/64=21/32
Let A be an event in a sample space S the complement of A is the set of all sample points of the space other than the sample point in A and it is denoted by,
Ā or Ā∈S,∉A
(i). (A∪Ā)=S
(ii). (A∩Ā)=Ø
(iii). Addition Theorem of Probability
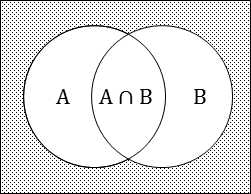
(a). For two events A and B
(b). For three events A, B and C
(iv). If A and B are two events, then
(v). If A and B are two events associated with a random experiment, then
(a). P(Ā∩B)=P(B)-P(A∩B)
(b). P(A∩B̄)=P(A)-P(A∩B)
(c). P(Ā∩B̄)=1-P(A∪B)
(d). P(Ā∪B̄)=1-P(A∩B)
(e). P(A)=P(A∩B)+P(A∩B̄)
(f). P(B)=P(A∩B)+P(B∩Ā)
Q15. In a group of 100 students, it was found that 40 study Maths A, 30 study Drama and 54 study neither.
(a) Draw a Venn diagram to display this information.
(b) If a student is chosen at random, what is the probability that this student studies Drama but not Maths A?
answer:
(a)

There are only 100 students
So, overlap =124-100=24
∴Number studying Maths A only
Number studying Drama only
(b) P(D but not M)=P(D only)
Q16. In a class it was found that 64% of the students like apples, 48% like bananas and 21% like both.
(a) Draw a Venn diagram showing the student preference.
(b) Find the probability that a student chosen at random is one who likes neither apples nor bananas.
answer:
(a)

percentage liking apples only =64-21=43%
percentage liking bananas only =48-21=27%
∴ percentage liking neither =100-(43+21+27)=9%
(b) P(likes neither apples nor bananas)=0.09
Q17. Given the following information:
P(A)=0.3;P(B and A)=0.2;P(B)=0.7
First draw a Venn diagram to represent this information. Then compute the value of P(B and (not A)).
answer:
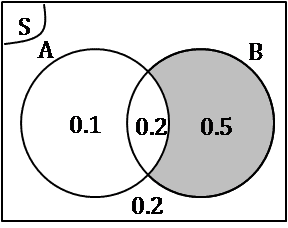
P(B and (not A))=0.5 is marked in blue on the Venn diagram.
Q18. You are given the following information:
P(A)=0.5;P(A and B)=0.2;P(not B)=0.6
Draw a Venn diagram to represent this information and determine P(A or B).
answer:

P(A or B)=0.7 is marked in blue on the Venn diagram.
Q19. Let A and B be events with P(A or B)=¾, P(Ᾱ)=⅔ and P(A and B)=¼.Find:
(a) P(A)
(b) P(B)
(c) P(A and B̄)
answer:
Using this Venn Diagram.

(a) P(A)+P(Ᾱ)=1→P(Ᾱ)=1-P(A)
(b) P(B)=P(Ᾱ)+P(A and B)
(c) P(A and B̄)=P(A)-P(A and B)
Q20. A and B are events such that P(A)=⅜,P(B)=½ and P(A and B)=¼. Find:
(a) P(Ᾱ) (d) P(Ᾱ and B̄)
(b) P(A or B) (e) P(Ᾱ or B̄)
(c) P(B̄) (f) P(B and Ᾱ)
answer:
Using this Venn Diagram.

(a) P(A)+P(Ᾱ)=1→P(Ᾱ)=1-P(A)
(b) P(A or B)=P(A)+P(B)-P(A and B)
(c) P(B)+P(B̄)=1→P(B̄)=1-P(A)
(d) P(Ᾱ and B̄)=1-P(A or B)
(e) P(Ᾱ or B̄)=1-P(A and B)
(f) P(B and Ᾱ)=P(B)-P(A and B)
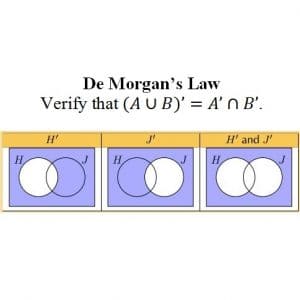
💪 How can we Calculate Probabilities with a Two-Set Venn Diagram? 💎




1 comment on Calculating Probabilities With a Two-Circle Venn Diagram